
Let’s face it: every serious business that wants to generate leads and revenue needs to have a marketing strategy that will help them in their quest for profit. Today’s digital data has given the power to an average Internet user a massive amount of information that helps him or her to choose between brands, products or offers, making the market a highly competitive arena for the best ones to survive. An important part of a successful business strategy is utilizing a modern data analysis tool and implementing a marketing report in its core procedures that will become the beating heart of acquiring customers, researching the market, providing detailed data insights into the most valuable information for any business: is our performance on track? Ultimately, it will provide a clear insight into relevant KPIs and build a solid foundation for increasing conversions.
If you are reading this, it probably means that you understand the importance of tracking your performance and its progression over time. Be it in marketing, or in sales, finance or for executives, reports are essential to assess your activity and evaluate the results. Management thinker Peter Drucker once stated, “if you can’t measure it, you can’t improve it” – and he couldn’t be more right. To know if you are successful, you first need to define success and track it. As we have already talked about in our previous blog post on sales reports for daily, weekly or monthly reporting, you need to figure out a couple of things when launching and executing a marketing campaign: are your efforts paying off? How do you know that? If you are doing things in the right way, should you do more of it? Or drastically change for another path?
Using the right marketing KPIs (key performance indicators) is a good start – what is now left is finding a way to organize it all in a way that makes sense and brings value. That’s why we will present annual, monthly, weekly, daily and digital marketing reports that you can use for your own promotional activities and upscale your marketing efforts. But first, we will start with a basic definition and some tips on creating these kinds of reports. Let’s dig deeper.
Download our short & sweet guide to daily, weekly and monthly reports.
What Is A Marketing Report?
A marketing report is a set of data created to analyze the performance of a specific marketing campaign or effort. It is utilized to effectively communicate a company’s marketing strategy, including research, promotional tactics, goals and expected outcomes.
How To Write A Marketing Report?

We’ve all heard of that famous end of the month when it’s time to deliver reports, be it in an agency or in-house. While your keyboard is burning and your fingers try to keep up with your brain and comprehend all the data you’re writing about, using an interactive online data visualization tool to set specific time parameters or goals you’ve been tracking can bring a lot of saved time and, consequently, a lot of saved money.
1. First things first – organizing and prioritizing your marketing data
And just like you schedule daily, weekly and monthly marketing activities, so will you build daily, weekly and monthly marketing reports. If you get your practice right and utilize some effective data driven marketing strategy tips and tricks, a report can be generated with just a few clicks. Below, in the article, we’ve gathered some of the marketing reports templates that can easily be used to perfect the efficiency of generating data and reduce the time needed to create it.
2. Use professional software
There are countless reports digging into your marketing data; the question usually is, where do I start? Are there any basic reports that could help me get more comfortable with these mountains of aggregated data? To get started, you might want to equip yourself with a marketing BI software to analyze all your data and easily build professional reports.
3. Structure your metrics
As with any report you might need to create, structuring and implementing metrics that will tell an interesting and educational data-story is crucial in our digital age. We will go into detail with each report below in the article, but it is important to keep in mind that low-level metrics such as CPC or CTR will not take part in the strategic report that focuses on customers’ costs. You need to decide which story you want to tell and to whom: your colleagues, supervisor or VP? That way you can choose the best possible metrics for your case.
4. Regularly monitor your data
Secondly, launching a campaign with achievable goals is only worth it if you check on them on a regular basis and see if you’re on track – waiting for the end of the campaign to see how it performed is, unfortunately, a common mistake people do, and the worst practice. As a Forbes article states, “there’s no such thing as ‘set it and forget it’ [in digital marketing]”. Noticing that something does not work as planned on the 7th day instead of the 47th is a lot of time saved, and less money wasted.
Types Of Marketing Reports
There are numerous marketing report types, depending on which data you need to monitor and analyze. Usually, reports are done on an annual, monthly, weekly or daily basis, but sometimes you need to create an ad-hoc, KPI report for a particular purpose.
That said, we will go into details of a marketing campaign report, provide a digital marketing report template, and look into marketing reporting and analysis with the help of carefully created dashboards.
But let’s get over some real data, starting with the annual marketing report.
Annual Marketing Report Examples
As with each part of a business, the end and beginning of a year is usually the time to reflect what was accomplished, conduct a few meetings, consolidate data and prepare for the year ahead. Marketing strategy reports such as annual ones focus on the biggest possible picture a department can have, usually with high-level metrics that will look at marketing activities on a broader spectrum, focusing on strategic developments and goals, discussed by the most senior marketing authorities a company might have such as the chief marketing officer (CMO).
Delivering milestones and reflecting on strengths and weaknesses will ensure your next year will be fresh, full of new opportunities and identified possibilities that will ensure you stay on the right path and deliver the best possible promotional results. Let’s see this through a marketing report sample focused on high-level metrics.
1) Marketing CMO report
**click to enlarge**
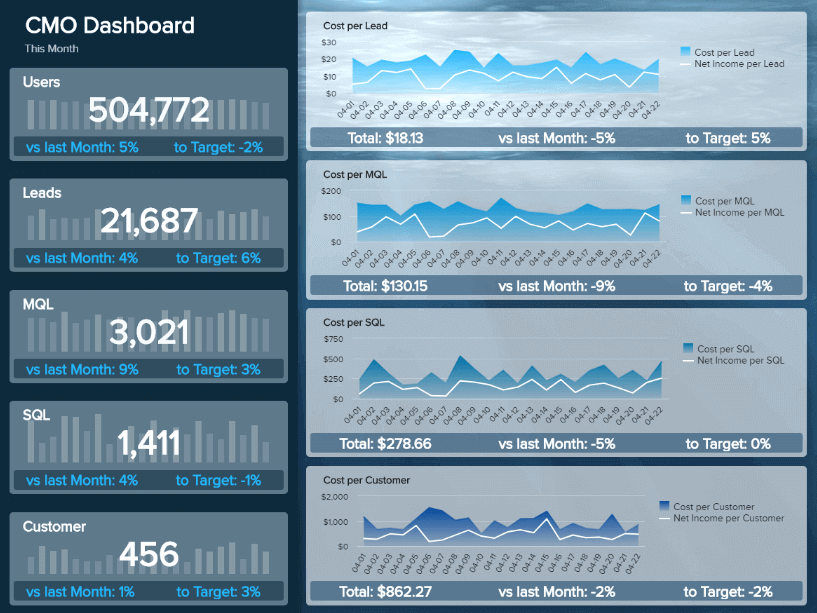
This is one of the marketing reporting template VPs, C-level executives and seniors can use to their strategic advantage and interact with each metric displayed on the screen. It shows how targets are performing in a monthly view, but the user can easily set this marketing dashboard to a yearly time frame. Often CMOs don’t have time to look into each detail of an advertising campaign but focus their resources into strategic goals of a company and this report shows us exactly what kind of metrics and insights are needed to be successful.
The layout of this marketing reporting template is clearly set to guide the viewer if the most important metrics have reached their goals or additional adjustments are needed. The funnel shows the total amount of users, leads, MQL, SQL, and customers, compared to the previous period and in relation to the set goal. We can see that our number of leads has increased by 4% in comparison to the previous period, but we still miss 6% to target. Other metrics are structured similarly, which gives the CMO a clear overview of which parts of the strategy need more attention.
On the right side of this marketing report format, you can dig deeper into relevant costs: per lead, per MQL, SQL and customer as well as total costs and net income of each metric. This is useful since seniors need to know and control customer costs and the quality of leads. That way, they can compare their findings with overall sales goals and see if there is a mismatch that leads to more adjustments on operational levels.
2) Marketing KPI Report
**click to enlarge**
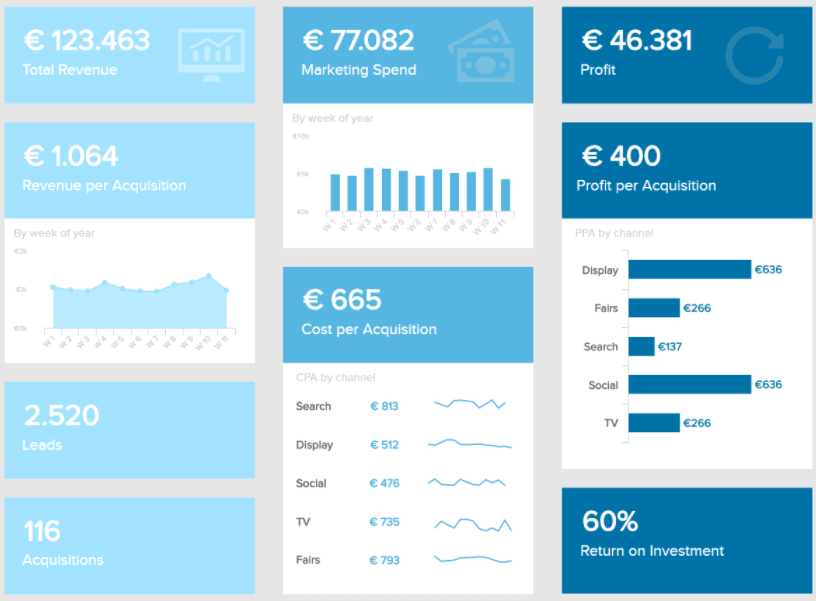
This report example gives a good overview of the most important marketing KPIs in a single glance: costs and revenue stats. In the end, this is what matters: did I get enough bang for my buck?
The design of this report for marketers is clear and lets you focus on the core metrics. Keep in mind that a metric like your CTR (click-through-rate) or the number of sessions should be understood in their globality, and not an absolute truth: increasing them will not systematically generate more profit or rise the ROI (return on investment) displayed on this dashboard. That’s why you should dig deeper: analyze the profit per acquisition you made, in comparison to the cost per acquisition over time. See which campaigns are acquiring the most customers, with the minimum of dollars invested in them. The goal is to have the highest possible return on investment at the lowest costs, but you should not forget about the whole funnel and compare it with other reports you will create.
In this particular example above, we can see how some of the metrics have performed by each week of a year, such as the revenue per acquisition, which will help you in building your future strategies and consolidate with operational objectives (more on that later). This is one of our digital marketing reports that can be seen on a monthly basis as well, it’s just a matter of filtering based on the desired time frame.
The point here is, looking at your different campaigns and channels is key to have the big picture and understand what is going on.
Monthly Marketing Report Examples And Templates
In our second part, we would like to stress the fact that you should also keep looking at the big picture. We have already stated that every report must correlate with the big picture in marketing and provide a steady connection with sales, but looking at a monthly level can deliver more insights than anything else. The weekly marketing report template we provided below in the article can be implemented into a broader perspective and utilized for monthly decisions. The channel bringing in the most traffic is not always the one bringing the best quality leads in the end – but that you cannot know before some weeks have passed. That is why a monthly marketing report is so useful, providing a cross-disciplinary overview of several parameters at stake in a campaign, that you can analyze conjointly for more accuracy.
This first monthly marketing report below provides you with a broader feeling of how your marketing campaigns are performing based on web analytics – even though, as we said, it can take too long to spot problems and adjust. This is why each of these different reports should be used conjointly, to get the best possible insights into the state of the whole department.
1) Web Analytics Report
**click to enlarge**
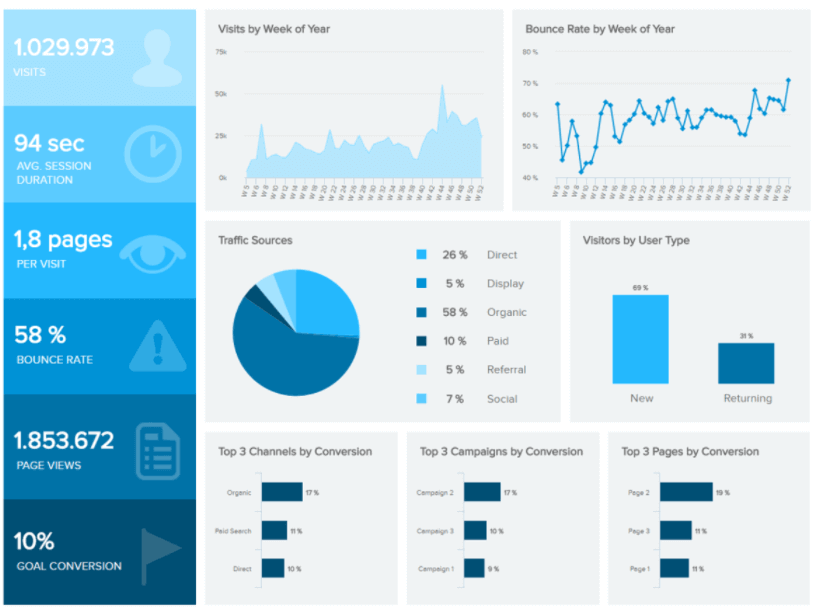
Simply, the web analytics dashboard will track all of your website traffic details that you get thanks to Google Analytics (GA). GA is a great tool and provides a lot of affordable data on your visitors. Well-designed, custom Google Analytics dashboards will give you a deeper understanding and greater clarity on your audience.
On this second monthly marketing report template, shown above, you can track basic info like the number of visitors over time, their behavior (new, returning, time on page, pages per session, …), the bounce rate, etc. In addition to the more general demographics, knowing your audience’s behavior is an asset. Secondly, monitoring the traffic sources is as important, as already stated earlier in this article. That way, you can tailor time and budget accordingly. Finally, the bottom line is the conversion. You want all of these people coming to your site to take action, and convert – whichever that conversion is, provided that you stated it beforehand: signing up for a newsletter, starting a free trial, watching a video, buying your product. Your monthly report should track these conversion rates and see how they perform compared to the initial goals.
This web marketing report basically consolidates all your GA data, often the only roadmap you have to see how your website performs and how visitors behave. Monitoring the traffic source, whether it’s paid, social, referral or organic, will tell you where your potential buyers are coming from and learn how you can improve your website to offer the best possible user experience that will, ultimately, increase your conversions.
2) Marketing Performance Report
**click to enlarge**
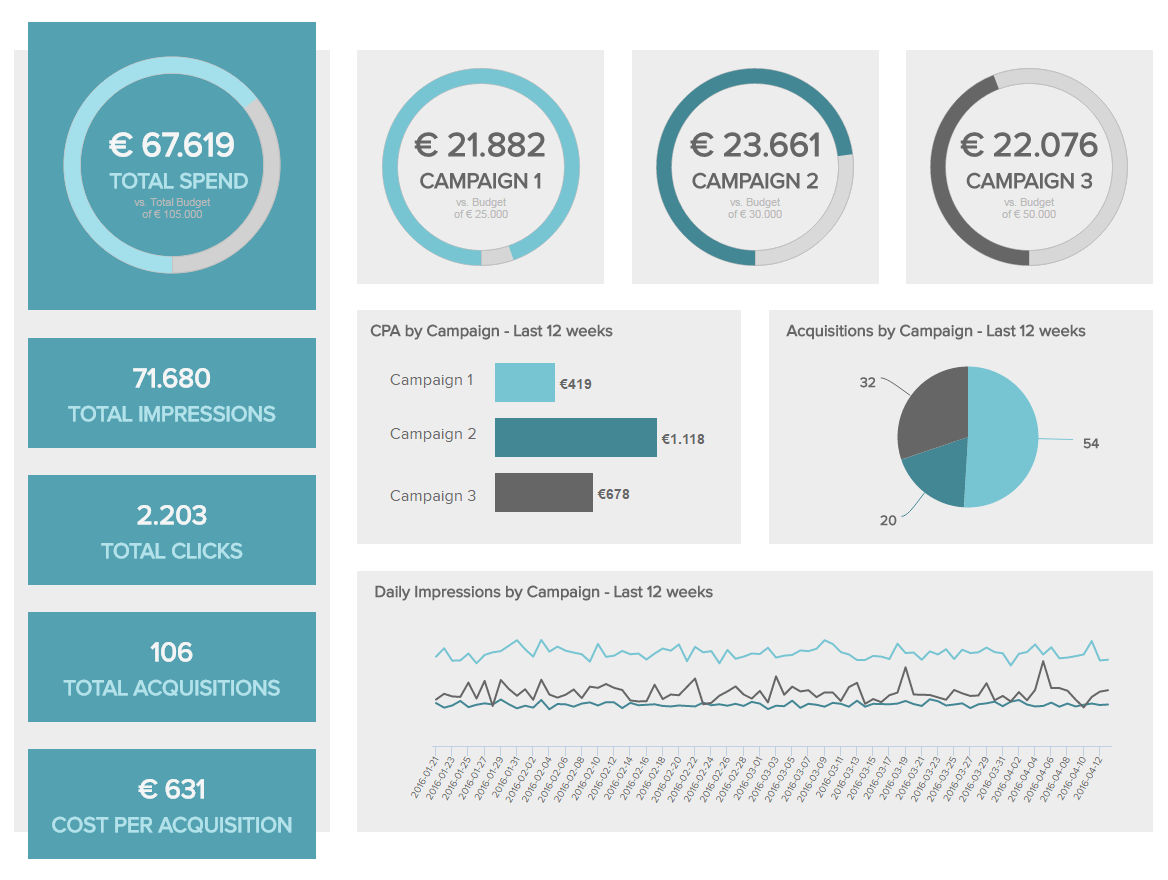
Our final monthly report is providing a good overview of the performance of all your paid advertisement campaigns. How much do you spend? Is it complying with what was initially planned? These are the questions you want to answer through that report. This monthly marketing report template also wants to answer, “how much are we spending to get a new customer”? The cost per acquisition (CPA) addresses that question according to the campaign, and you can see which is the most profitable. Thanks to these insights you know how to acquire a new customer with the minimum of investments, and can then replicate the best practices from that campaign.
In essence, this marketing campaign report template is focused on the costs of your paid promotional activities that you can easily compare, drill down into bits and pieces of each campaign and decide what strategy works best. Monitoring the total spent budget, amount of clicks, and the total number of acquisitions, just to name a few, will certainly give you an insight into which campaign performed best, which ones didn’t live to your expectations, and why.
Thanks to the data gathered on that marketing campaign performance report, you have all in hand to strategically decide where to allocate your money.
Weekly Marketing Report Examples And KPIs
The weekly monitoring of your traffic will ensure that there is no “breakdown” in the performance, that could affect a whole month’s progress. A weekly report will gather data that can be of the utmost importance to the overall marketing strategy. If you see on a daily basis that your channels aren’t performing the way you expected them to, then the weekly summary can provide you with more insights and create a basis for future decisions. Especially in digital marketing reporting, where data can change on a daily basis, but keeping in mind the big picture is crucial for a successful campaign.
Now let’s approach some new aspects of this kind of report, on a weekly basis.
1) Blog Traffic And Blog Leads Report
Some research showed that within a week of posting, a blog article’s traffic can drop by 90%. This is mainly due to the fact that you share the article on social media, which explains the short-term traffic, and the fact that after getting a couple of hundreds of visitors, depending on your reach, it may drop significantly. If it has been optimized for SEO though, you shouldn’t stop measuring it after the first week, as it needs a couple of months to reach its “cruising traffic”, and you can get several thousands of monthly visits. Tracking the weekly development of the blog traffic will show you how it actually takes off. You don’t need to panic if you don’t see the results right away, but do keep in mind the weekly progress to know when to take specific actions. If a blog post doesn’t deliver immediate results, it should not affect the whole marketing strategy, patience, in this case, is key.
We can see in our example below which pages have the highest number of visitors, but you can also adjust and easily filter by the number of leads. This is useful to track on a weekly basis to see if any changes in traffic or leads will signal a more lengthy trend.

**click to enlarge**
We know by now how important blogs are for companies, and not only for ranking on Google. Correlation is not limited to the number of times a company blogs and the traffic they drive, but also to the number of leads they generate. Producing a blog leads report gives a quick overview of how many leads you bring every week with your articles. Sharpening the analysis, a bit more, you can see which category of articles is bringing the most traffic, and focus then on improving the quality of content in that category, to attract even more.
Keep in mind also regular search engine updates, such as the ones from Google, that affect your traffic each time they take place. Sometimes you can be the greatest winner, but sometimes you need to adjust the content to get back on the top of your blog performance.
Download our short & sweet guide to daily, weekly and monthly reports.
2) Website Traffic And Leads Per Channel
What we described above can also be applied to your website traffic in general. Breaking it down into channels and analyze which ones are bringing in the most leads may shed light on under-performing (or on the contrary, super-performing) channels that may need more attention and investments. The number of sessions by source or by channel groupings, can track your traffic in many different ways thanks to Google Analytics KPIs available in your GA account. Having an interactive report tool to establish your performance on a weekly basis can reduce the amount of time needed to consider additional actions or to simply decide what will the next step be.
Identify which channel from paid, organic, social, referral or any other is your gem and increment your strategies’ performance in order to boost the traffic coming from it. Although keep in mind your long-term performance is one of the most important parameters to decide in which way you have to adjust your campaigns and efforts, weekly summaries can decrease the number of interdepartmental meetings between marketing professionals, and provide a faster way to analyze big data.
3) Online Advertising Performance
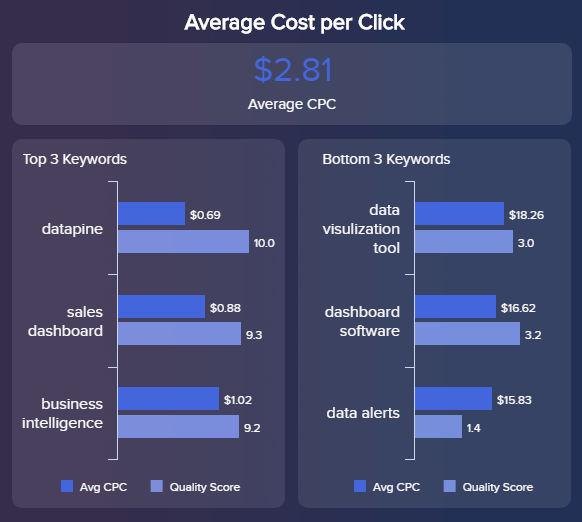
**click to enlarge**
If you choose to invest money to advertise online, you also need to track how it performs. The most common pricing model, Cost-Per-Click (CPC), as presented in the picture above, is used by the main search engines like Google Ads, Yahoo Search Marketing, or Yandex Direct. In our example above, we focused on the CPC and keyword performance as well as quality scores to get a more holistic overview of our paid campaigns. You pay a fixed price for each click on your ad, and the goal is to decrease that price over time, which will decrease as a result of your customer acquisition costs (as long as your conversion rate is not decreasing). When you choose the most suitable online advertising model for your business, you can set your payment also on CPM or CPA, it all depends on which platform you want to advertise, how big is your marketing budget and which goals you expect. For example, there are programmatic advertising technologies that have their own sets of platforms on which your advertisement is shown. Also, if you set a branding campaign, then it differentiates from the standard paid search campaign. It all depends on your overall marketing strategy and how it aligns with your general sales report, which you have to keep in mind since sales are directly interconnected with marketing activities.
In the example below, we can see the total amount of the spent budget in connection with weeks and channels. Using this data can provide insights on whether your investments are stable or need more optimization to deliver specified targets. These data sets can be broken down on the specific week of interest, meaning you can interactively follow-up on what happened in week 11 in regards to week 10. Although these data can also be utilized in monthly or yearly reports, this weekly marketing report template can be a source of input on how to track and analyze your efforts.

**click to enlarge**
Now that we have gone over some weekly marketing report templates, let’s move to a shorter vision. Daily reports are not so common as monthly ones, especially for SEO marketing, where you should not think too short-termed. But let’s see this through examples and marketing report analysis.
Daily Marketing Report Examples And KPIs
The general purpose of our marketing reporting templates is to give you tools to make better-informed decisions. A daily report will help you do that at a faster pace. You can use it to create an action plan every morning: what did you accomplish the day before, and what can be done better today. It can allow you to interact with your data almost in real-time, so you can be positive that information, objectives, and strategies are fresh and on track. Although the overall result of the marketing strategy will not be affected on a daily basis, using these kinds of reports can provide more details into the daily activities of the campaign setting.
A daily marketing report will also allow you for faster experimentation: running small operations to answer small questions. This keeps everyone proactive to see a problem early enough and adapt, to avoid wasting money. Besides, your team and yourself will know your numbers perfectly, enticing more confidence for everyone when a decision has to be made.
On a daily basis, though, a lot of things are out of your control – especially in marketing. One single day will definitely not determine the outcome of a campaign, but several days in a row can indicate a trend. While you shouldn’t tie yourself up in too much daily reporting, checking in on a couple of activities every day is the best practice. Here are some examples of KPIs you can track on a daily basis:
1) Website Traffic
For inbound marketing, website traffic is the blood and pulse: you need to attract a certain audience (new or returning), before turning them into prospects and actual customers. After setting a traffic goal for the month, you can divide it by the number of days in the month to set your daily target and see if you come close to it or not. For greater precision, you can adjust according to your business, and if weekdays/weekends impact or not. Monitoring your website traffic can help identify sudden rise or drop, lets you act straight away, and should encourage you to communicate with the sales team, whose number of leads and qualified leads will also probably be affected.
You can also filter the channel-specific traffic, meaning you can instantly look for sources like organic traffic, referrals, social media, email, or paid search, and see which channels are performing well, and keep an eye on how they behave in relation to your goals, so that you can optimize them on time and prevent unnecessary budget expenditure. The important thing to emphasize is to not change all your defined structures or goals merely because your daily activity hasn’t performed as expected. Let’s take a look at an example.

The example above shows the exact percentage of the traffic sources gained through a specific time interval, in this case, daily. While organic search definitely shows the biggest value of this specific performance, the display shouldn’t be disregarded simply because on that specific day didn’t perform that well. But if this tendency of almost 50% of the overall traffic gained develops in the same direction, then it can be concluded that parts of the budget can be optimized for channels that are performing better.
2) Engagement On Social Media
We never say it enough, but engagement is key. For your brand to be known and your name to be memorized, daily activity on various social newsfeeds of your audience will not only increase your chances to reach a higher number of people with time, but it will also increase your chances to engage with them. No one discusses with a brand whose last post on social media was three months ago. Inactivity in today’s prolific discussion and sharing channels (Facebook, Twitter, Instagram, but also LinkedIn, Snapchat and Pinterest) is digging your own grave.
Find the channel that fits you better, but most importantly, where you can reach your audience better (50-year-old businesspeople do not use the same channels as teenagers, who somehow tend to create and make trends, so stay tuned). Communicate daily or every couple of days through it. Don’t throw uninteresting news just to have attention, or you will easily lose it; build a strategy and provide valuable content. Respond to questions, add yourself in relevant groups, interact with possible customers or clients and listen to what the market and audience say.
While it depends on the industry you are part of, social media is a great tool to interact directly, on a personal level and build a community around your products or services. That being said, building a community management strategy can also provide an additional source of a marketing activity that can be tracked and evaluated on a daily basis. By listening to your clients and customers, you can also improve your product or service and generate more ideas that can be utilized and implemented in other marketing channels and activities.

**click to enlarge**
Researches have shown that content shared on Facebook and Twitter live from 15 minutes to 6 hours – which makes it a good daily KPI to track. Over a day, you can determine how engaging your post was and how much traffic it brought to your website. Although metrics and algorithms of digital media change regularly, social media is still quite an important part of a marketing strategy. By adjusting your social efforts to the right audience, it can still bring value and traffic.
You can also check our social media reporting article and get a comprehensive overview of how different SM behaves and how you can utilize them in the most effective way.
Download our short & sweet guide to daily, weekly and monthly reports.
Digital Marketing Reports And Templates
These examples can also help a business to create a digital marketing report. In this data-driven world, it is essential to keep your digital efforts in a concise, factual and presentable way. Digital marketing has become a must-have part of the overall strategy, and to make sure you have all your data in one place, a KPI dashboard software can track a campaign’s performance in real-time, while setting an alarm so you can be automatically notified when specific digital marketing KPIs changes its course or performs below expectations. Let’s see this through some examples.
1) Content Quality Control

**click to enlarge**
We all know the old content marketing saying: content is king, context is queen. To be certain your content production and article engagement is on its track, this digital marketing report example showcases a peek into an interactive dashboard representing the most important data for creating a content piece. With this marketing report template, you can get a clear overview of all the content stages before and after publishing. By seeing how much time a story needs to be written, you can conclude if the writer is struggling, or there is not enough time for the reviewing process? This whole story turnaround can provide deeper data-insights and, therefore, drive to measurable actions by decision-makers.
2) Google Ads Digital Marketing Analysis Report
Google is one of the most popular platforms for digital marketers who look for search engine optimized content to rank, paid by the cost per click (CPC) or cost per mille (CPM). We have already expanded on paid options earlier in the article, but this section is dedicated to one of the biggest search engines in the world: Google.
Most marketers have advertised on Google at some point in their careers. While Google gives many options to track and present your results, it does have some limitations that can easily be solved with a comprehensive live dashboard.

**click to enlarge**
This dashboard showcases the most prominent Google AdWords metrics focused on the analysis of keyword information and data. As you can see, the number of clicks is compared to the previous period, following by a performance overview throughout selected weeks. The top keywords section will immediately let you know what kind of keywords generated the highest amount of clicks and where most of your budget has been spent. The details of the average CTR per position makes sense to track since it will help you to create a benchmark for used keywords where you will see if you need additional adjustments or your campaign is performing well. The position of your ad will influence the CTR and you should keep in mind that is almost impossible to obtain an upper position with a below-average CTR.
3) LinkedIn Report
While we have mentioned the importance of including social media into your promotional efforts, we have selected one network to showcase a holistic approach in reporting practices: LinkedIn. As we know, LinkedIn is a powerful business network that can generate numerous B2B promotional results such as increased engagement, number of followers, and, ultimately, leads. That’s why it is important to track social networks as part of your promotional activities as possibilities are endless.
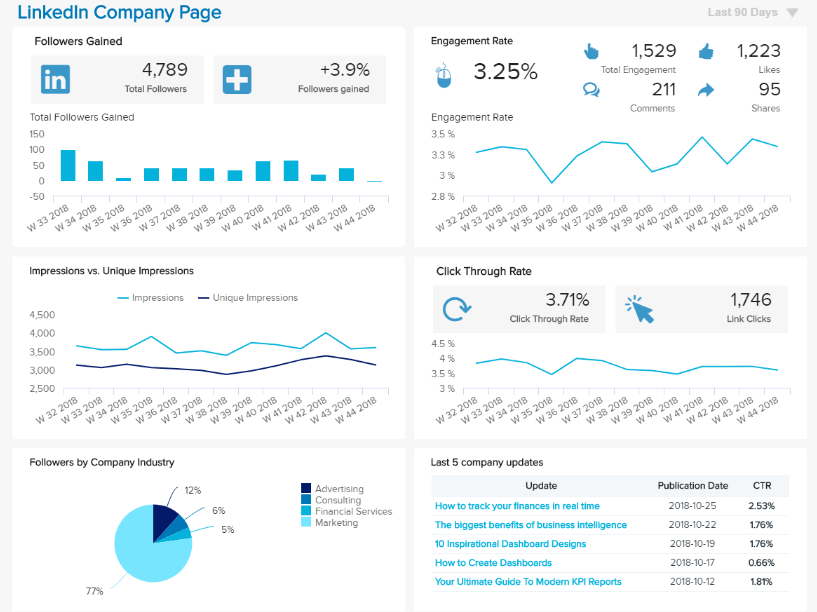
**click to enlarge**
This extensive report puts a spotlight into invaluable company performance on this social network. One of the marketing reporting best practices includes gathering the most important LinkedIn metrics and holistically looking at how they complement each other and what can be done to ensure the best possible results.
In this case, we take a closer look at where your company stands in terms of gained followers. By understanding your audience, you will have better chances to create compelling content and target based on their professional backgrounds such as industry (you will definitely create a different content if you target software enthusiasts or law professionals). This is one of our dashboard ideas that will help you to consolidate all your LinkedIn company page data under one roof, giving you details about the CTR, engagement rate, and short overview of the last 5 updates.
Download our short & sweet guide to daily, weekly and monthly reports.
We have answered what is marketing reporting, provided extensive examples, analyzed various reports and given you tips on what to focus on when creating your own. Why so much data analysis, in the end? Simply because we started this article with Peter Drucker’s quote, “what isn’t measured, cannot be improved”. These reports are slicing, dicing, and analyzing data, while connects the dots between your marketing activities and the goals originally set. They help you draw conclusions – but also lessons! – from your campaigns, various tests, and mistakes. They help you spot problems as well as opportunities to catch, and replicate success.
To start benefitting from your marketing data and create professional dashboards, start our 14-day free trial and create reports with just a few clicks!
The post 12 Marketing Reports Examples You Can Use For Annual, Monthly, Weekly And Daily Reporting Practice appeared first on BI Blog | Data Visualization & Analytics Blog | datapine.