
Companies, organizations, enterprises, large, or small businesses – no matter in which category you belong to, you need to pay close attention to your customers. A customer retention dashboard and metrics depicted in a neat visual will help you in monitoring, analyzing, and managing multiple customer-centric points and how they echo in your business. Especially in the SaaS B2B area, where different packages and subscription models have immense value in defining the quality of the company, the possibility to establish itself on the market, and generate sustainable development.
That said, in this article, we will discuss a customer retention dashboard created with a modern dashboard tool and coupled with metrics and KPIs needed to achieve growth and, finally, answer the question: How do you track customer retention? But first, let’s start with a basic definition.
Try our professional dashboard software for 14 days, completely free!
What Is A Customer Retention Dashboard?
A customer retention dashboard is a visual tool used to track key customer-centric metrics such as retention rate, churn rates, MRR growth, and the number of loyal customers. That way, a business generates detailed insights about its health and growth opportunities.
To reach success in our competitive environment, businesses must put customers first. This notion is not only important for SaaS companies but also in the B2C area such as online shops. While we will focus our examples on the B2B SaaS businesses, each company, no matter the size or business model, should focus its efforts on retaining clients, and continuously optimizing the customer retention analysis process in order to save time and money. It’s a known fact that acquiring new customers can be expensive, therefore, customer retention metrics shouldn’t be disregarded but, on the contrary, monitored regularly. A professional dashboard maker can help in the process, but let’s see this through some visual examples of customer retention.
Our Customer Retention Dashboard Example
Measuring customer retention with modern and professional software is critical for any SaaS business that wants to establish a healthy relationship with its customers, share the knowledge with internal teams, and keep a positive business development environment. Let’s take a closer look at how dashboards for retention look in a SaaS environment.
**click to enlarge**
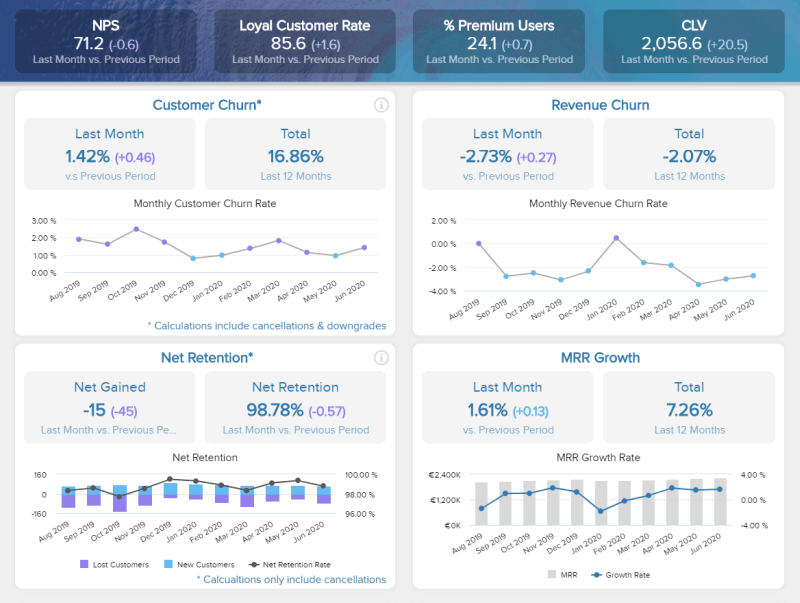
This business dashboard starts with an at-a-glance overview of the net promoter score (NPS), loyal customer rate, the percentage of premium users, and the customer lifetime value (CLV). These SaaS retention metrics depend on the specific company’s policies and the way that they define whether a customer is considered loyal or premium. Usually, the premium categorization is considered as customers that subscribe to the biggest package that a SaaS business offers but it can also depend, as mentioned. Below this quick overview, you can see the comparison between the last month and the previous period, therefore, you can conclude that the net promoter score is a bit lower while other top metrics of this SaaS dashboard have a positive development.
Doing exceptional work for your clients and customers is a critical point of this dashboard because customers will cancel their subscription if they’re not satisfied with your business and simply go elsewhere. The next parts, organized in 4 main areas will show you the details of how successful your strategies work: the customer and revenue churn, net retention, and MRR growth.
The retention and churn are the pillars of successful business optimization since both are closely connected but describe different things. Our customer churn analysis example shows that the total percentage amounts to almost 17% for the past 12 months. The development is clearly shown in a line chart where users can immediately see how it behaved during the specific time frame. Here we need to emphasize that, in this calculation, the cancellations and downgrades are both included because they both affect the revenue, especially if bigger packages are downgraded to the smallest ones which can cause significant effects.
At the bottom of the dashboard, you can see the other 2 areas focused on net retention and MRR. The graph on the left shows that the business is quite stable, slightly lower in comparison to the previous period but the development on the bottom graph shows the details between the number of lost customers, new customers, and the retention rate. Some months performed better while others could use additional examination with the help of a BI dashboard software to create better and more lucrative strategies for the future.
Finally, the monthly recurring revenue (MRR) is an increasingly important part of developing and sustaining a profitable SaaS company. These kinds of dashboards for customer retention should show the details of the MRR: growth for the last month, total, and the growth rate over the course of 11 months. You can see that January shows a decline in the growth rate, which can possibly mean that clients canceled their subscription at the end of the year.
If you’re eager to create such an interactive visual, we suggest you read our guide on how to create a dashboard.
In our next part of the article, we will focus on retention metrics examples, similar to ones depicted on the customer service retention dashboard above, but they can also be adjusted for specific business uses, as mentioned earlier.
Try our professional dashboard software for 14 days, completely free!
Customer Retention Metrics Examples
Since we explained the exact customer retention dashboard definition, provided you with a data-story of a stable SaaS business that can brainstorm ideas for further growth. Now we will talk about each metric in detail and why they are important in establishing a proper process on how to measure customer retention.
1. Net customer retention KPI
The monthly net retention is a critical metric that contributes to the growth and it can cause significant differences in revenue generation over longer periods of time. If you don’t cherish and develop positive relationships with your customers, it will show in the numbers and cause an impact on the bottom line.
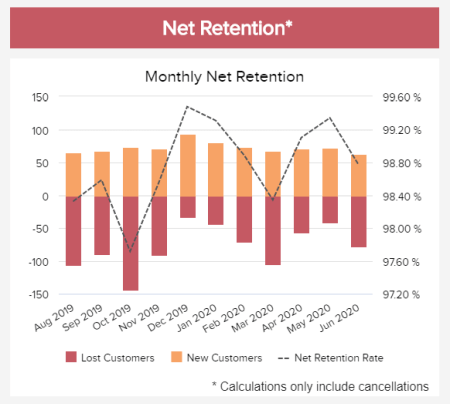
To get a better understanding of underlying customer dynamics, the net retention will show you the number of lost customers, new customers, and the net retention rate but, in the visual above, calculations only include cancellations to get a clear picture of the customers’ behavior towards the product. You can see that some months have achieved more success than others but that doesn’t have to be discouraging, it simply shows that the business should examine in more detail why customers canceled and improve the product or service for the future.
2. MRR growth rate
The MRR is a metric that gives SaaS companies the most accurate status checkup. The recurring components will enable you to forecast the financial future much better, and give you a clear understanding of your business development and whether you need further adjustments.
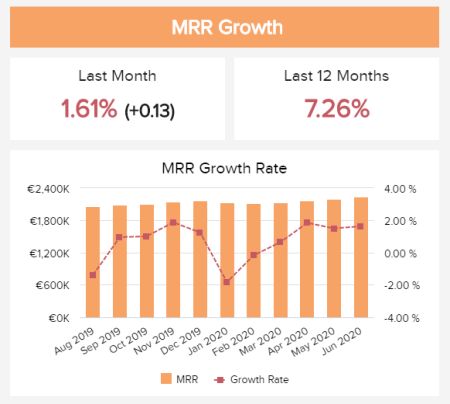
In the example above, we can see that in the last 12 months the MRR grew for more than 7% and the growth rate over a longer period of time seems stable but, as always, there is room to grow even more. To learn more about the details of the importance and management of the MRR, we suggest you read our guide on the topic of monthly recurring revenue.
3. Customer churn
The customer churn is another critical metric that affects the SaaS client retention processes. Also known as the customer attrition, this metric will show you the exact percentage of customers that stopped using your product or service. It’s crucial to keep this percentage as low as possible since lower churn rates mean your customers are loyal, satisfied with the product, and will not turn their backs on you.

This visual above, created with a customer retention dashboard tool, shows the monthly churn rate that includes cancellations and downgrades. In a wide sense, churn can also mean the closure of an account, decision to stop buying and use another provider, etc., but that depends on which industry you work in. The point is to keep the churn low, provide exceptional customer service, continuously exceed customers’ expectations, and listen to your customers.
4. Revenue churn
The revenue churn also refers to loss, but that of revenue. It can happen due to lost contracts, downgrades, bankruptcies, etc. It assesses the degree on which customers spend over a period of time, and, if they spend more in the current period than in the previous one, this is shown as a negative revenue churn.

In the example above, we can see that in the last month and last year, the churn rate was negative and that signals a positive development. The progress on a monthly period is shown in a simple line chart where you can immediately identify which months performed best and learn from the ones that haven’t achieved success.
Try our professional dashboard software for 14 days, completely free!
Key Takeaways
We have explained the importance of the churn and retention rate, went into details of dashboards that focus on sustainable business growth. As we mentioned, client churn dashboards have a critical role in staying healthy in our competitive environment.
To start your own journey and utilize modern customer retention dashboard software, you can sign up for datapine’s 14-day trial, completely free!
The post Customer Retention Dashboard & Metrics Examples For Modern Companies appeared first on BI Blog | Data Visualization & Analytics Blog | datapine.