
Customer service shouldn’t just be a department, it should be the entire company.” – Tony Hsieh, CEO of Zappos
Consumers are more empowered than ever before. With access to an ever-growing number of digital touchpoints for connecting with peers, conducting research, and making all-important buying decisions, it’s up to today’s businesses to provide a level of service that is outstanding across the board.
There’s no denying it: providing a flawless level of customer service is vital if you want to enjoy a successful and sustainable commercial future – and it’s likely that your contact center is the beating heart of your entire consumer-facing operation.
That said, to improve the overall efficiency, productivity, performance, and intelligence of your contact center you will need to leverage the wealth of digital data available at your fingertips. And the best way to do so is by using digital dashboards and a modern online reporting tool.
Before looking at the benefits, features, and functions of call center reporting processes, it’s important to consider the role of a customer service center report in formulating a forward-thinking, innovative business strategy that will ultimately transform your service levels from average to exceptional (and keep them that way).
But before we go any further, let’s consider what a call center report is and what it does.
What Is A Call Center Dashboard?

A call center dashboard is an intuitive visual reporting tool that displays a range of relevant call center metrics and KPIs that allow customer service managers and teams to monitor and optimize performance and spot emerging trends in a central location.
The digestible visual displays associated with call center reporting not only help to simplify analysis, thereby significantly reducing data consumption time – but the interactive nature of these reports empowers users to extract invaluable real-time data with ease.
Online data visualization tools are the fast track to improved customer service intelligence, and robust contact center dashboards exist for that very purpose.
We offer a 14-day free trial. Benefit from a great call center reports today!
The Benefits Of Call Center Dashboards And Reports
As you may have gathered, contact center dashboards are vital to the ongoing health, cohesion, and success of your business’s customer service activities.
To put the power of these call customer service-centric reports into perspective, here is a glance at the benefits of call center interactive dashboards:
- A consumer-based analysis report can help you improve your customer-facing interactions exponentially by helping you to increase overall productivity and improve complaint response and resolution rates.
- The data offered by a contact department dashboard will provide a level of insight that will help you spot service inefficiencies, empowering you to streamline your processes, cutting costs, enhancing service, and employee motivation levels as a direct result of your efforts.
- Agent metrics will help you to support those that need help in particular areas of their role while helping to engage your staff by using a more personable approach. These actions will lead to a happier workforce, in turn, enhancing the level of support you give to your customers.
- With robust real-time data analytics, you can spot trends and deal with any potential issues as they occur, nipping them in the bud before they spiral into more detrimental, time-consuming problems.
- As the data is presented in an interactive, intuitive, and visual format, it’s possible to view, absorb, analyze, and share vital data with ease, saving time and aiding cross-departmental collaboration. Plus, the completely customizable nature of contact center technology means that you can tailor your KPI dashboards to your specific needs or preferences, making your data-driven insights all the more digestible across the board.
- When considering how to build a contact center dashboard, communication is key. As modern customer service performance dashboards are accessible via a multitude of mediums, including mobile, customer service executives and support agents can view and analyze essential metrics at the swipe of a screen or the click of a button 24/7, simply by creating a modern mobile dashboard – improved communication and enhanced organizational transparency in one smart data-driven dashboard.
Without a doubt, to deliver a truly exceptional level of customer service, it’s imperative to understand your consumers and their interactions on a deeper level – that’s where contact center-based data analytics come in.
Put simply, customer service is the beating heart of your entire operation. Once you decide to invest more in your customer-facing efforts and take measures to improve your strategies, you will reap great rewards.
Consider this for a moment: it’s possible to trace the history of commerce back to 150,000 years, with face-to-face communication being the only viable means of customer services. Some 1,500 centuries later, not only do we have a multitude of communicative methods but a depth of digital insight that can help us make vital customer service-based decisions – and customer service performance dashboards make sense of this wealth of available information. But not only, as online data analysis offers the means to identify your strengths, weaknesses, faults, and triumphs in a variety of areas, and you can use this information to improve and enhance your business on an ongoing basis – customer services is one of those areas.
A contact center report helps organizations to take corrective measures to set internal targets, monitor agent performance levels and analyze efficiencies in various areas including complaint resolution, response rate, and overall productivity levels.
The rate at which data is produced has now increased exponentially. For example, 40,000 search queries are performed per second via Google alone, which equates to 3.46 million searches per day and 1.2 trillion each year. The data is out there, and by using it to your advantage, you stand to improve every element of your service center’s performance.
Seventy-five percent of businesses report that they are measuring customer engagement but cannot define what it is. Embrace the power of contact center reporting and call center analytics, and you will accelerate your business growth exponentially. Now we will take a look at the best steps, tips, and tricks to analyze your data in a customer-centric environment.
How Do You Analyze Data In A Call Center?
We’ve established that call center dashboards offer a wealth of invaluable information for streamlining your consumer-facing activities. But how do you analyze call center performance and success?
When it comes to improving your department with call center data analytics, there are a number of key elements to consider. Here, we’re going to look at why and how to analyze your contact center for improved performance and success – starting with the importance of setting your goals.

1. Set your goals
Once you’ve made the executive decision to invest in your service strategies and dig deeper into contact center metrics, analytics, and reporting, you will need to set clear-cut goals.
While your ultimate goal in terms of call center analytics reporting will be to improve your customer service offerings and maintain them, if you want to yield real results, it’s important to establish specific areas of potential improvement.
Gather in a collaborative environment and ask yourself why and how you might want to improve your customer service center strategies. Here are some questions you might want to consider:
- How responsive are our agents, and can we improve our overall responsivity levels?
- How efficient is our existing customer service department structure?
- Does everyone in the department have the tools and data to perform their job to the best of their capabilities?
- Are my contact center staff members happy and motivated?
- How financially efficient is my department’s operation?
- Should I take measures to improve communication and innovation in my customer service department?
By asking yourself these essential questions, you will be able to set actionable goals and, in turn, use a call center analytics dashboard to achieve the results you deserve. Once you’ve set your goals, you will be able to select the right customer service KPIs to give you the visual intelligence you need to succeed.
2. Work with the right metrics
Once you’ve set clear-cut strategic goals and have a better understanding of the KPIs you will need to work with to achieve them, it’s time to dig a little deeper into contact center reporting and analytics.
When you consider the question, ‘how do you analyze data in a call center?’, metrics are the answer. If you work with the right metrics in your call center metrics dashboard, you will gain the level of insight you need to make your customer service department the most efficient it can be.
Here are the key metrics you should consider including within your call center dashboard software:
- First Response Time
- Call Volume Trends
- Call Handle Time
- First Call Resolution (FCR)
- Quality of Recent Support
- Customer Satisfaction & Recommendations
- Top Support Agents
- Customer Retention
- Support Costs Vs. Revenue
To discover more about these essential customer service-based metrics and their importance in the context of a contact center dashboard, read our full guide on call center metrics, analytics, and reporting.
3. Support your agents
It doesn’t matter how streamlined your customer service strategies are – if your support agents are disengaged, unmotivated, or unproductive, your department will suffer.
When working with a call center metrics dashboard, it’s important you analyze KPIs and metrics related to support agent performance on a regular basis. Doing so should be a top priority.
If you notice problems in individual or group performance, you will be able to drill down deeper into the issue and put strategic measures in place to improve engagement, performance, and motivation.
For instance, if you notice that a particular agent’s performance is consistently dwindling, you can reach out and offer tailored support or training that will empower them to do their job better. Never underestimate the power of helping the people on the front line – especially if you have the data to do so.
4. Analyze all touchpoints
In the digital age, consumers have a multitude of communicative platforms and touchpoints at their fingertips. From telephone support to email and social media, when it comes to providing a seamless level of support, it’s vital to cover all possible touchpoints.
A call center performance dashboard offers a wealth of invaluable insight that will empower you to build a customer service team that exceeds expectations on a regular basis, and by allowing your support talents to analyze data in other related areas of the business, you will push yourself ahead of the pack.
We offer a 14-day free trial. Benefit from a great call center reports today!
See Here Call Center Dashboard Reporting Examples
A contact department report is an incredibly powerful tool for modern business. To put this notion into perspective here are three examples of our customer service-based dashboards in addition to the key KPI examples associated with each report.
1. Call Center Team Dashboard
**click to enlarge**
Our call center team dashboard drills down into your team’s daily, weekly or monthly performance, providing an insight into resolution times, response rates and optimal service times. Created with a powerful dashboard builder, this visual will ensure your team has a clear overview of their performance and results.
Moreover, this call report provides information on the number of issues your customer department receives, priceless customer feedback on a regular basis as well as metrics on the performance of individual agents.
This balanced mix of data will not only help you take measures to train, engage, and motivate the staff that needs the most support while rewarding your top performers, resulting in improved complaints resolutions and response rates, but by gaining consumer feedback, you will also be able to make vital changes to your internal processes.
Primary KPIs:
- Average Response Time
- First Call Resolution
- Top Agents
- Number of Issues
2. Call Center Customer Satisfaction Dashboard

**click to enlarge**
Today’s consumers value the opinion of their peers over anything else, so keeping your customers satisfied should be a top priority.
Honing in on essential metrics including Net Promoter Score (NPS), ongoing customer satisfaction levels, customer effort scores, and customer retention rates, this report is invaluable to the ongoing improvement made to your business’ customer experience activities.
Each of the KPIs displayed on the dashboard are geared toward improving all of your customer-facing strategies, giving you the power to make critical changes to your service tactics – the kind of tweaks that will help your customers get exactly what they want while minimizing the effort they need to make to get it.
By evolving your customer service department in these areas and drilling down into contact center data analytics, you will be able to improve your customer strategy in a big way, boosting your customer retention rates as well as your brand’s reputation.
Primary KPIs
- Customer Satisfaction
- Net Promoter Score
- Customer Effort Score
- Customer Retention
3. Customer Support KPI Dashboard
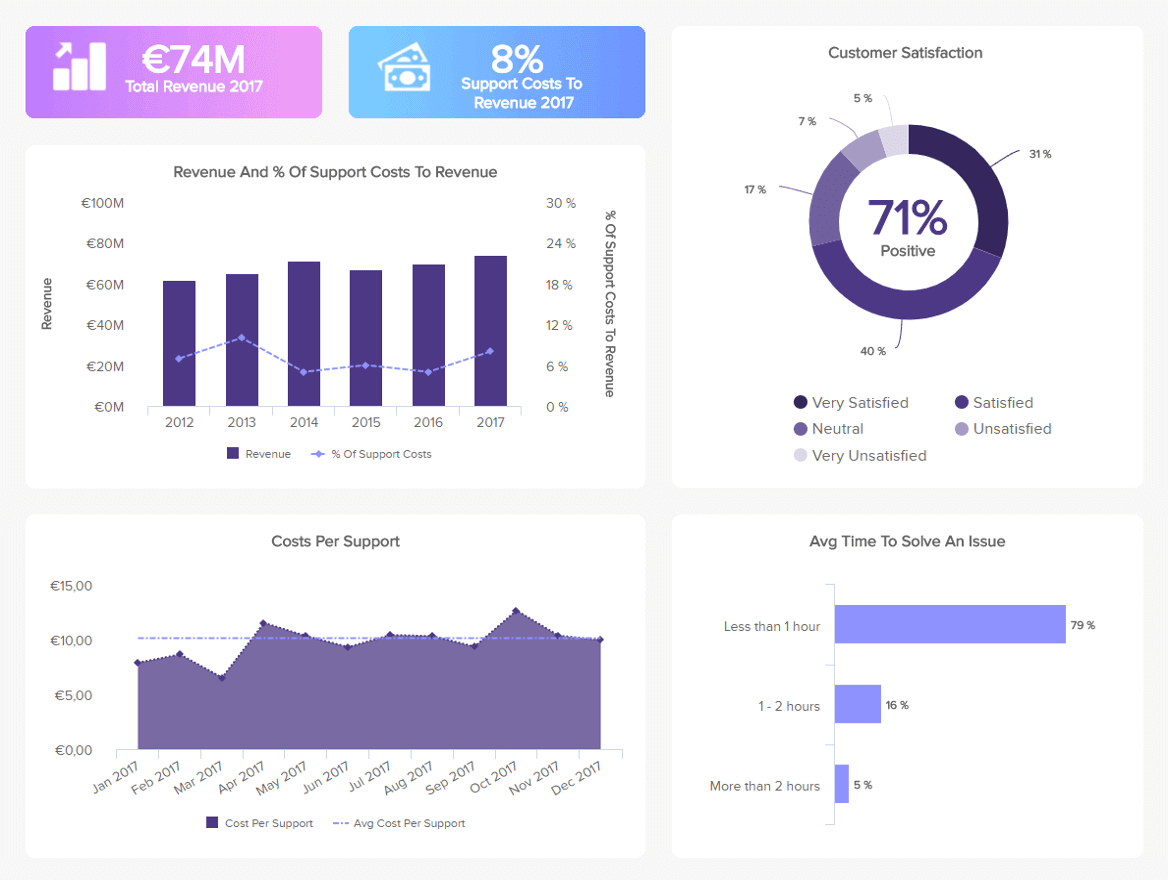
**click to enlarge**
While this particular call center dashboard focuses on customer satisfaction and service levels, it also offers an under the skin glance at important customer service revenues and ongoing support costs.
Measuring the percentage of costs against your revenue offers a clear snapshot of how much is invested in your call center support teams relative to the income you generate. Investing in your customer support team, activities, and infrastructure is, of course, essential, as this will result in increased customer retention and a boost in brand loyalty, and the display on this report will help you do this more efficiently, cutting unnecessary costs and placing focus on the areas that require the most attention.
Our customer support business dashboard gathers priceless customer feedback, offers metrics that help improve support levels and provides a sustainable means of enhancing your customer service center’s bottom line, making it an incredibly valuable tool for the contemporary customer-facing business.
Primary KPIs
- Service Level
- Support Costs vs Revenue
- Customer Satisfaction
4. Daily Operational Zendesk Dashboard
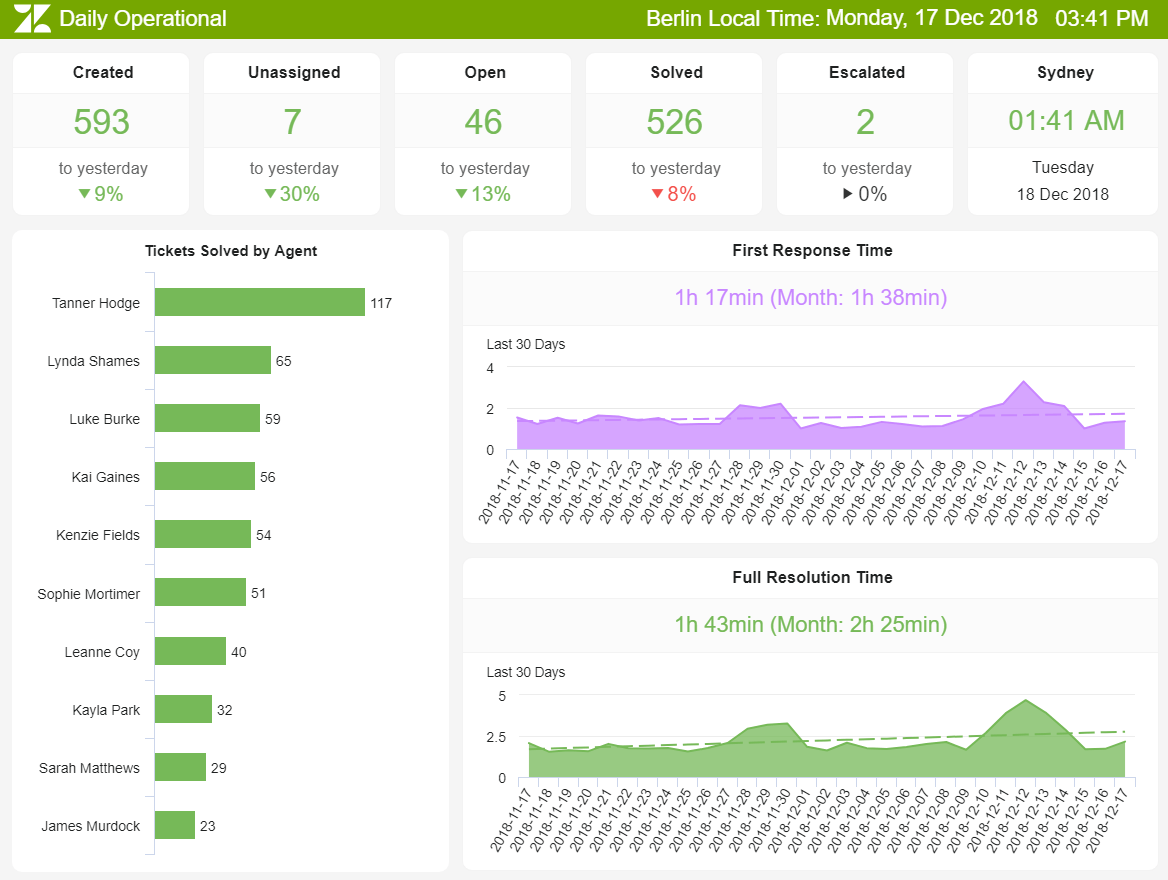
**click to enlarge**
When it comes to streamlining your customer service strategies, Zendesk is a powerful tool. This dynamic Zendesk dashboard offers invaluable means of squeezing every last drop of value from this invaluable platform. Although it can be used for managing daily customer support operations, call centers can utilize it for their ticket systems as well.
Visually appealing, logically formatted, and equipped with focused KPIs designed to enhance call center performance, this most powerful of call center report samples is essential for any modern organization across industries.
Offering trend-based data as well as detailed service insights, our Zendesk dashboards is an effective means of quantifying and maintaining your customer service operations on a day-to-day basis – a testament to the power of call center dashboards.
Primary KPIs:
- Tickets & Ticket-Status
- First Response Time (FRT)
- Average Resolution Time
5. Zendesk KPI Dashboard

**click to enlarge**
Last but certainly not least in our rundown of call center dashboard examples, our Zendesk KPI platform is an invaluable tool for streamlining your customer service strategy. If you have to deal with large volumes of calls from people who are seeking technical support, then integrating such a dashboard might be a great solution.
Boasting the perfect storm of data visualizations and long term strategic KPIs, this invaluable performance dashboard provides the tools necessary to meet the ever-changing needs of your customers while enhancing your consumer-facing initiatives over time while tracking all your ticket statuses on a single screen.
Not only does this effective tool assist in the ongoing improvement of your call center performance, but it also offers a wider scope on the moves you will need to make to improve your service initiatives across all consumer-facing platforms and touchpoints.
Primary KPIs:
- Customer Satisfaction
- Tickets by Types
- Tickets by Channel
“Good customer service costs less than bad customer service.” – Sally Gronow
We offer a 14-day free trial. Benefit from a great call center reports today!
Eighty-four percent of companies that work to enhance their levels of customer service and experience report a notable increase in their revenue.
We’ve considered the questions “how is call center performance measured” and “how to build a call center dashboard.” We’ve also looked at powerful real-world examples that demonstrate the level of detail contact center-based technology provides both on a short- and long-term basis. And the message is clear: by leveraging the right data and technology, you have absolutely everything to gain – and so do your customers. It’s a two-way street, and by investing in customer service, you will be rewarded with long-term success.
Yes, in the digital age, customers judge brands and businesses based on the level of customer service they deliver. That said, to thrive, and indeed, survive, in tomorrow’s world, ensuring that your call center is operating at an optimum level is essential.
By using data-driven reports and analytics to your advantage, you stand to make the tweaks, changes, and enhancements necessary for tangible long-term success, making your customer service department an efficient, productive, intelligent, and well-oiled machine long into the future.
Are you ready to delve into the rewarding world of contact center analytics? To learn more and start your data-driven journey, try our 14-day trial – for free! We look forward to working with you.
The post Call Center Dashboard – Reporting & Analytics In Our Data-driven World appeared first on BI Blog | Data Visualization & Analytics Blog | datapine.