
“There is only one boss. The customer.” – Sam Walton, Walmart’s founder
Customer experience is slowly but surely exceeding both price and product as the world’s most critical brand differentiator, according to numerous articles over the Internet written by industry experts. Brands with the ability to build flawless customer experiences and offer exceptional standards of customer service (CS) stand to set themselves apart from their competitors in a notable way.
When it comes to CS, in particular, today’s digital consumer is very much in charge. Due to the hyperconnected, incredibly convenient, and instantaneous nature of the modern consumer world, and the number of touchpoints on offer, maintaining excellent levels of service by utilizing carefully selected customer service KPIs is the ultimate key to survival.
That said, if you’re able to answer customer queries quickly and effectively, you stand to increase your brand loyalty ten-fold. To optimize your CS offerings you need access to the right data, and this is where customer service reports come into play.
In this article, we will explain all the necessary information you need to obtain about customer service reporting, and provide essential industry examples and templates. Let’s get started.
Get our guide to learn about the power of customer service reporting!
What Is A Customer Service Report?
Customer service reports extract invaluable information and insights from customer service data. By increasing the service levels, customer satisfaction, and loyalty, among many other metrics, organizations can ultimately generate business value and increase profits.
**professional customer service report example**
From average response time to NPS score, a customer service report provides a deep and valuable insight into key areas of your consumer-facing efforts. In turn, this will provide you with an astute understanding of the positive areas to build upon and the areas of improvement.
To provide the best possible standards of CS on a consistent basis, understanding how your consumers interact with your business is vital. Having the right online reporting tool will ensure your customer service data stays up to date and evolves as your business scenarios change.
What Are The Benefits Of Customer Service Reports?
In the digital age, consumers are more empowered, more tech-savvy, and more demanding than ever before. If you don’t satisfy a customer’s needs or resolve their issues almost instantly or with a degree of competency that they deem unacceptable, they simply will not stick around. Add to this the fact that customers now trust the opinions of their peers more than the brand itself, focusing on your CS offerings should be your topmost priority if you want to succeed.
There are seemingly infinite benefits to the pursuit of customer reporting. By gaining access to the insights and data, you can:
- Improve your company’s best response time:
The response time is the backbone of any CS department or organization. We have written a bit more on the average response time as one of our metrics examples below in our article, but the main point is to keep it as short as possible. If you track this metric in your reports, you can significantly improve it by identifying your bottlenecks (maybe the number of available agents during a rush-hour shift is too low, for example).
- Prevent customers from having to call back about a repeat issue:
Let’s face it, customers don’t like to call back or repetitively point out a single issue. By utilizing comprehensive reports in which you can include the first call resolution metric (FCR) or recorded calls as they’re critical, you will have immediate access to data and a better chance to act promptly, without providing low-level service that can cost you in the long run. Setting detailed reports on a single screen will enable you to increase the level of your service department and ensure customers are taking care of at all times.
- Reward your top-performing support agents and boost internal morale:
Top-performing agents should be rewarded. If you see beneficial results in your reports, investigate further and see whose work has brought those results. Better yet, implement a team KPI dashboard that will show you immediately how your team is performing and where do you need to allocate more resources (educational materials or workshops) so that the whole department has more chance to improve their results. You can also ask your top agents to educate other team members and provide them with tactics that bring success and sustainable development.
- Track the level and nature of customer issues over time to make informed strategic decisions:
If you lose track and count of your customer issues when you manually insert data into a spreadsheet, you can cause serious issues in the long run. It’s simple to miss a row or comment made by another colleague, non-intentionally, but definitely harmful. If your report, for example, has set intelligent alarms that will send you a notification as soon as an anomaly occurs, you can improve the tracking of customer issues and create an environment that will improve your decision-making processes in the future.
- Gain a deeper insight into how your business is perceived by your customers:
A satisfied customer is worth more than any other indicator you could possibly track or evaluate. It is fairly known that a contented customer will recommend you on average to 3 friends, while the unsatisfied ones have the power to access and write on the Internet about their experiences with your brand. By regularly evaluating how you are perceived by your customers, you have the power to predict and act on potential future business obstacles.
- Evaluate and improve your net promoter score:
Net promoter score is one of the customer satisfaction metrics that is, simply put, all about referrals. The goal is to obtain as many promoters as you can which will enable you to expand your business and enhance your loyalty rates. The more loyal customers you have, the more rewards your business will reap. If you properly take advantage of ensuring your reports include also the net promoter score, you will be able to quickly evaluate how detractors, neutrals, and promoters affect your bottom line.
- Enhance priceless customer retention and loyalty rates:
Closely connected to the net promoter score, the customer retention and loyalty rate are all focused on gaining your customers’ trust and enabling them to spread positive words about your organization. Retaining a customer is essentially much less expensive than gaining a new one and with the help of a proper reporting practice, your CS department can thrive – you can increase the retention and loyalty rates and allocate your extra budget in other channels, for example.
- Make your CS department more effective by reducing support costs:
Reducing support costs is not about cutting down the manpower or investing the lowest amount of dollars into your support department. It’s mainly about optimizing your processes and reaching the highest quality of your services with the lowest costs possible. That would mean that your agents are efficient, trained pretty well, and the agents’ schedules are corresponding with the needs of the department. To have an at a glance overview, creating a customer support report will ensure that you monitor your expenses regularly and efficiently.
Get our guide to learn about the power of customer service reporting!
It’s clear that there are a host of tangible benefits as stated in our 8 points above, and many of them will have a positive impact on other areas of the business. To get details into each mentioned KPI, you can read more about it below in our examples section of the article.
In short, customer service reports offer the power to understand your company to make informed decisions based on accurate insights rather than making estimations and taking actions that offer little value to the organization or its customers.
Companies that grow their customer retention rates by as little as 5% often see profit increases ranging from 25% to 95%. Through reporting, you’ll not only be able to boost your retention rates significantly but you’ll also be able to boost your brand’s reputation, thereby resulting in commercial growth and increased profits.
We live in a world rife with invaluable digital insights and data. If you fail to use this information to your advantage, you are missing out on vital opportunities that can improve efficiency, output, and cohesion of your organization’s CS department, which could prove disastrous in the long run.
How To Write A Customer Service Report?
While customer service data is priceless to any modern organization, regardless of its industry or sector, due to the colossal volume of information available on a daily basis, creating and managing it effectively can prove to be challenging. To improve your bottom line, here is a roadmap to get started:

1. Create a detailed reporting plan
To generate the best possible report, you have to create a solid plan. You need to understand the scope of the data that you are going to report on and the roles of the stakeholders involved. Creating a draft to ensure you have all the steps covered beforehand will save you a lot of time later on. At the beginning of your reporting process, you can look at the bigger picture and identify what kind of report are you going to generate (more on that below), who are you going to address, and what is your end goal. Preparation and planning are key factors in creating a stable and gainful reporting practice, and you should not skip this step.
2. Structure your report based on the end-user
Depending on whether you selected KPIs for your support team, departmental or c-level manager, structuring your data is of utmost importance. Who will use the customer report is the baseline of your report creation. This is also closely connected to selecting the right metrics (more on this below) as the team leader won’t collect and analyze the same data as the support agent, but focus on the team’s performance, for example, to be able to provide necessary trainings and ensure stable processes. On a comprehensive online dashboard, you can automatically monitor your top agents, the number of issues or the first call resolution time.
3. Choose your KPIs carefully
Each business is different and insights that might prove particularly useful to one business might not be the same for another. However, selecting the right KPIs for your business in a collaborative capacity is essential to the customer service reports’ success. The average response time will tell you how long does it take for an agent to respond to a customer call. If you respond as quickly as possible, your brand image will remain positive and the customer will certainly not complain. On the other hand, if you put them on hold for a longer period of time (more than a minute), the probability that they will hang up significantly increases but also the potential to harm your reputation.
Once you’ve identified the information that will help you enhance your CS offerings the most, you will be able to set up a visual data dashboard customized to your needs, goals, and objectives. To ensure that you get optimum value from certain KPIs and metrics, you should set measurement time parameters that will give you a comprehensive snapshot of averages and trends. It will also give you the most accurate view of your customer service data. That brings us to our next point.
4. Monitor and analyze your data regularly
To ensure your customer service analysis report provides invaluable quality and the best possible data, you need to regularly monitor and analyze your findings. To create a sustainable customer KPI report, utilizing modern software and intelligent tools will make sure your data is up to date and valid in any given situation. By monitoring your information in real-time and graphically representing data through a series of charts you can easily manipulate and drill down into bits and pieces that would, otherwise, remain hidden. The analysis part is one of the most important steps you need to perform in order to successfully build and maintain a profitable strategy. Customer reporting isn’t just collecting numerous data, but analyzing the numbers and answering important questions will enable lucrative results across the board.
5. Share your reports and derive actionable insights
Submitting your results via scheduled, automated e-mails or sharing an interactive dashboard will cut the time needed to generate, consolidate and export numerous data points you might have. Sharing information is another important aspect of creating and managing customer support reports. To be able to fully focus on what is crucial in your reporting practice, it would be extremely beneficial to automate your reports on weekly or monthly time intervals, for example. That way you won’t need to spend numerous hours on exporting spreadsheets or preparing presentations, but your data will be immediately accessible while you can focus on what matters the most: actionable insights.
These were some basic tips on how to create a successful customer service analysis report and improve your bottom line. To see how this functions in practice, we have gathered 3 most prominent types of CS reports in which we present crucial KPIs based on different goals we have set and insights we want to find out.
Get our guide to learn about the power of customer service reporting!
Types Of Customer Service Reports – Best Examples
We’ve looked at the what and why of customer service reporting, now we’re going to explore the 3 primary customer dashboards associated with an organization’s various CS-based activities.
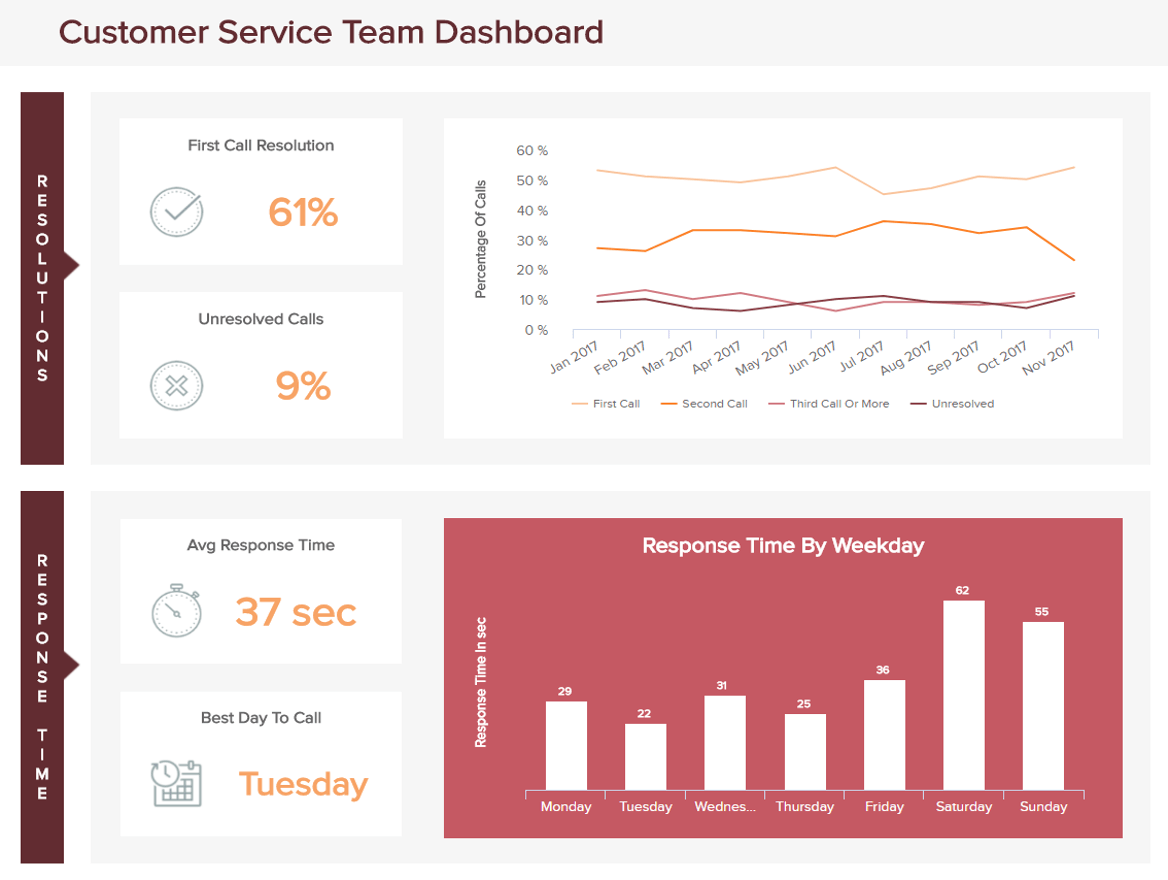
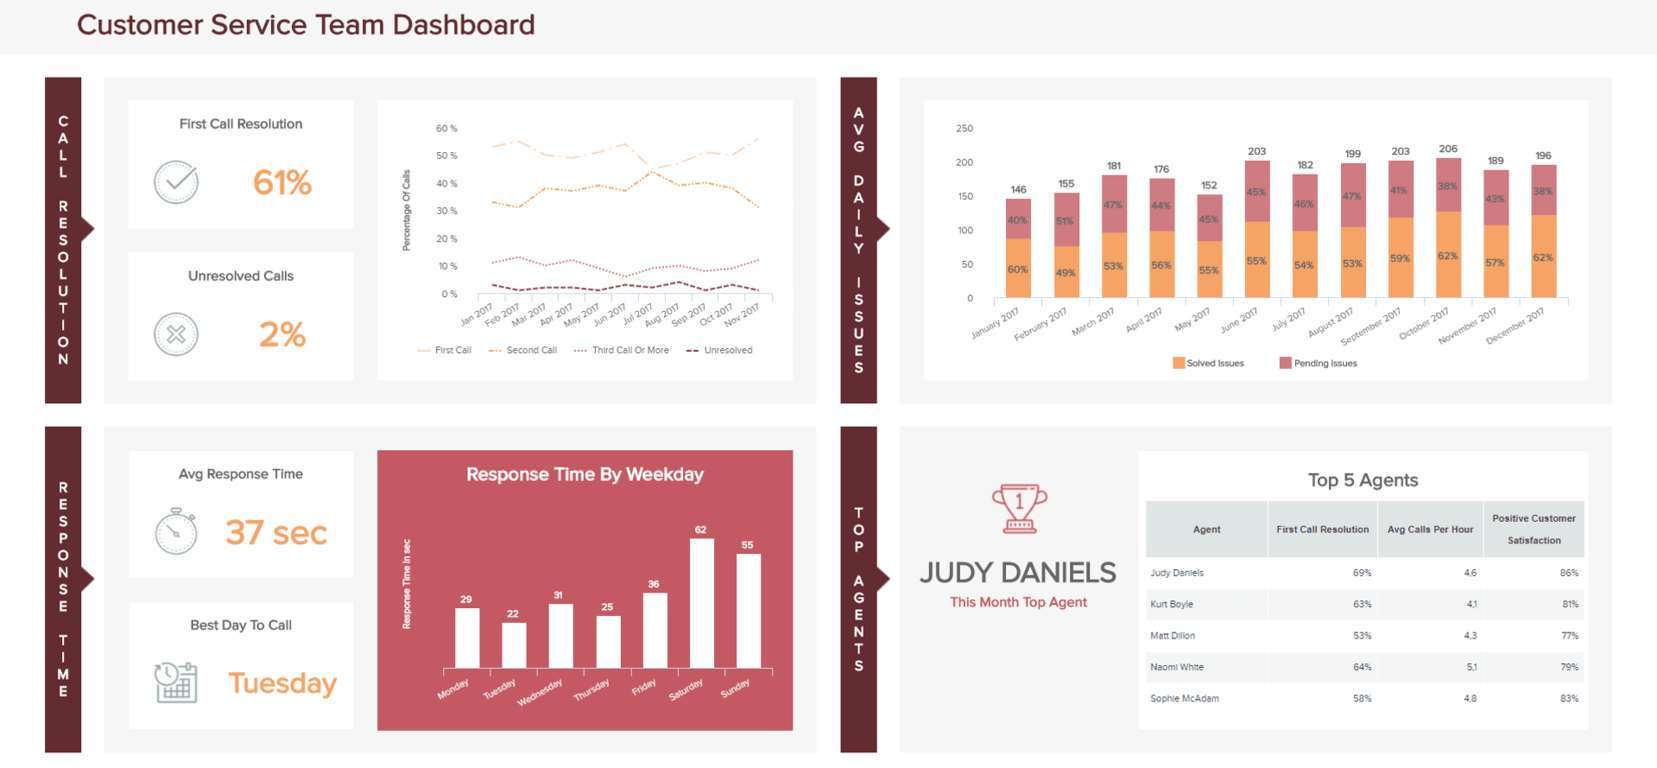
1. Customer service team report
In this day and age, to provide an exceptional standard of service, you must exceed customer expectations.
**click to enlarge**
This first customer service report sample hones your team’s overall performance on a daily and monthly basis by focusing on service levels, response time and individual agent performance all in one centralized space. Your team’s performance is vital to the success of your entire operation and this dashboard will help you make the kind of valuable contributions towards driving your business forward.
Main KPIs:
- Average response time: To enhance your customer satisfaction level and productivity rates, keeping your average response time to a minimum is a must. This particular KPI measures the time right from the moment a customer makes a call to the moment an agent responds. This along with other related KPIs offer an excellent insight into your overall customer service performance levels.
- First call resolution: One of the most important customer service metrics you can track, the First call resolution rate gives a clear indication of how successful your team is at solving an issue upon the first contact. An improvement in this area might increase your call handle rate, but it will have little impact if your first call resolution level has improved.
- Top agents: Staff satisfaction and morale are perhaps one of the most vital drivers of positive customer service performance. By tracking this metric over several months, you’ll be able to identify which of your agents can benefit from additional support and training and which agents you should reward and recognize.
- The number of issues: By understanding the volume of calls and queries coming into your business as well as the nature of each inquiry, you’ll be able to make informed staffing decisions to cope with demand at particular times while improving your strategy to meet the needs of your customers.
2. Customer satisfaction report
Customer satisfaction remains a number one priority for today’s businesses as it translates to an increase in brand loyalty and in many cases, an increased spend per customer.

**click to enlarge**
Focused on all primary aspects of customer satisfaction, experience, perception, and retention, this particular customer service report example will help you keep your consumer happy, engaged, and loyal to your business.
Main KPIs:
- Net promoter score (NPS): Your NPS is critical to your entire operation because it shows the perception of your service levels by the public. Essentially, it determines how likely someone is to refer you to their peers. On a scale of 1 – 10, and based on their scores, customers are either considered promoters (9-10), passives (7-8), or detractors (0-6). By improving your NPS score, you’ll ultimately see an increase in growth and loyalty.
- Customer effort score: This is a particularly critical KPI as it gives you a glimpse into the standard over your overall customer experience offerings. By understanding the elements of your customer experience that are letting your business down, you’ll be able to make vital improvements and in turn, grow the business.
- Customer retention: As mentioned, customer retention is essential to the success of your organization. By setting a retention rate target and working towards it, you’ll improve your brand image and expand your customer base over time.
3. Customer support KPI report
Regardless of your customer service role or level of seniority, there’s always room for improvement.
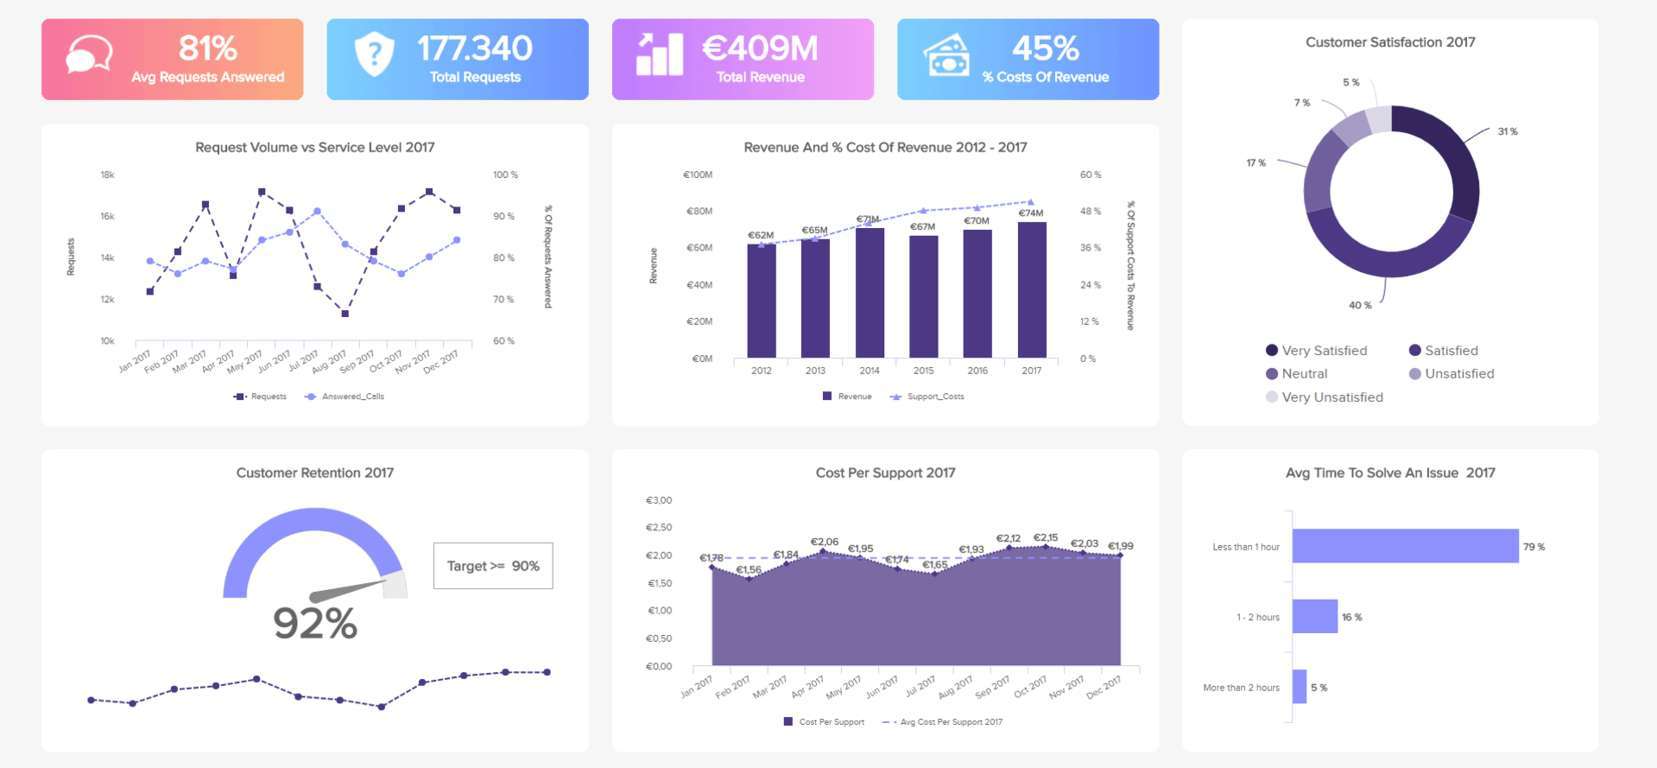
**click to enlarge**
That last customer service report template is heavily populated with information and tracks a host of metrics that are common to a helpdesk dashboard in addition to customer satisfaction or even a customer service dashboard. With a wealth of invaluable insights available on one easy-to-navigate platform, this dashboard offers managers all the support information they need at a glance with the option to drill deeper into individual metrics and insights.
Main KPIs:
- Service level: This particular metric calculates your capacity to complete the standards confirmed in the service level agreement (SLA) you provide to your customers. This KPI is important as it showcases your commitment to delivering on your promises and will help you identify ways in which you can improve your overall service standards.
- Customer support vs revenue: A priceless support metric, this KPI helps you to calculate how much the support costs are in relation to the total revenue. If you can provide incredibly high standards of service for decreased costs, commercial growth and increased revenue are inevitable. This KPI will help you gain the insights you need to achieve this goal.
- Customer satisfaction: A satisfied customer lies at the beating heart of every successful business. By getting a tangible gauge on what your customers currently think of you and your service, you’ll be able to make improvements in areas that matter most.
Get our guide to learn about the power of customer service reporting!
To thrive and survive in tomorrow’s world, providing outstanding levels of service is absolutely essential. By harnessing the power of customer service reports today you’ll win big on tomorrow’s digital battlefield. With the help of dashboard software, you can seamlessly create powerful dashboards that will help you monitor day-to-day activities and improve the support you provide.
We have expounded on the types of customer service reports, provided tips on how to write a customer service report and extensively explained metrics we used in our dashboards. Now it’s your turn!
To onboard the reporting train, give our 14-day free trial a go!
The post How To Extract Maximum Value Of Your Customer Service Data With Professional Customer Service Reports appeared first on BI Blog | Data Visualization & Analytics Blog | datapine.