
To compete, evolve, and remain relevant, today’s most forward-thinking businesses prioritize the continual improvement of their internal processes while measuring their success with pinpoint accuracy – and hiring talent is no exception.
According to ManpowerGroup, around 72.8% of companies are experiencing difficulties when trying to source skilled candidates, and 45% of employers are concerned about finding employees with the right talents for particular roles within the organization.
Despite the fact that there’s a wealth of talented job-seekers out there, connecting with the best possible candidates proves to be an exceptional challenge for most of today’s organizations. Not only is it important to source the right talent for the job, but it’s also essential for your new recruits to fit into your internal culture, remaining motivated, happy, and engaged at all times. That’s where recruitment metrics come in.
By utilizing recruiting KPIs presented through the medium of visual and interactive HR dashboards, it’s possible to use recruitment metrics to better interpret and evaluate a variety of talent acquisition factors that aid in hiring processes. By embracing recruitment analytics with the help of various HR KPIs, you’ll be able to develop new strategies that will have a positive impact on your organization from human resources, interdepartmental collaboration, and KPI management perspectives.
To help you understand recruitment analytics and hiring metrics on a deeper, more practical level, we’re going to explore the benefits of using recruitment KPIs, explore the meaning of metrics and analytics in recruitment, glance at recruiting dashboards, showcase 15 effective recruitment metrics examples, and provide you essential tips to create your own recruiting report practice.
Let’s get started.
What Is Recruitment Analytics?
Recruitment analytics is a process of using data-driven metrics and insights to improve the sourcing of the best candidates for different roles within your organization that will help you cut costs and better understand factors that are influencing your hiring process.
Before we delve any deeper into the dynamics of recruitment metrics and dashboards, it’s important to understand the meaning of recruitment analytics as well as its role in the business world.
When you are an organization looking to hire new employees, analytics and data analysis tools allow you to read data patterns that help you to formulate information-driven strategies. In this case, you will need strategies that will help you hire the most qualified employees that are best for the position.
In order to read these data and analytics patterns, human resources departments use online business intelligence to help them consolidate the data and work on it. Thanks to their data visualization capabilities, they can easily elaborate recruitment dashboards, which are tools that help people to read and understand data patterns in a streamlined, comprehensive manner. You can use recruitment dashboards to input a variety of KPIs or metrics into the system, and you can evaluate a variety of factors that will aid your hiring strategies.
Now, in a data-driven business world, you have to be able to leverage data so that you can stay on top of the competition, hire the right employees, make sure your managers are following the best contracting practices, and take steps to ensure that the employees are functioning within your organization to the very best of their abilities.
By leveraging the power of recruitment analytics to your advantage and working with an interactive dashboard software, you’ll be able to streamline your talent acquisition efforts in a number of key areas, including vacancy fill times, application reviews, talent screening and shortlisting, and hire value or accuracy – among many others.
Measuring, exploring, and analyzing recruitment analytics that is relevant to your business’s hiring goals over set timeframes will help you refine your efforts over time, reducing inefficiencies while streamlining your processes while recruitment KPIs will help you set and measure specific hiring-based goals for your business, which will ultimately help your organization to source and retain the kind of talent that will propel it to prosperous new heights. Now that you know details about recruitment analytics, let’s focus on recruitment KPIs and the basic definition.
“The competition to hire the best will increase in the years ahead. Companies that give extra flexibility to their employees will have the edge in this area.” – Bill Gates
What Are Recruitment KPIs?
Recruitment KPIs are business indicators that help HR professionals and managers to optimize the recruiting process, improve their performance, and enhance productivity with the help of metrics such as time to fill, cost per hire, recruiting conversion rate, etc.
Such metrics are critical in establishing a healthy HR process and, ultimately, bring sustainable development to the company and its resources. We will now go into more details of what you can learn of such indicators and what kind of help they can offer.
What You Can Learn From Recruitment Metrics
Before we get into the finer details and specifics metric tools to use for your recruitment dashboards, it’s important to understand what exactly you can learn from recruiting metrics. Start by considering the following points:
- How long does it take to hire employees?
- Is your potential candidate the right fit for the job?
- How much money are you spending on the entire hiring process?
- How efficient are you in the hiring process?
- How many candidates are applying for your job postings?
- Which places are the candidates looking for your job postings?
- How well does your new employee perform at the job?
- Does the job description that you provided with the listing accurately represent the actual job details?
- Is your recruitment journey engaging, transparent, and efficient?
With the help of these points, you can use recruitment metrics on your real-time dashboard and generate astonishing amounts of insights.
As you will slowly discover, there is some extremely valuable information that you can gain from using recruiting metrics. In an information-driven world, using the appropriate online data visualization tools to understand what lies behind these numbers and figures will help you play your cards right. Now that recruiting talented professionals propels your business forward into success, you do not want to miss opportunities to better understand how to acquire the ideal employees before your competition gets there first.
Now that you understand the fundamentals of metrics and analytics in recruitment, let’s look at the importance of a modern recruitment dashboard.
“Be curious. Use data. Leverage imagination. Be an expert. Be an enthusiast. Be authentic. Know your competition.” – Jim Stroud
Why You Need Recruitment Dashboards
HR dashboards are increasingly popular and important in today’s human resources departments. They help visualize key information to manage the workforce the best way possible, and understand potential pain points, in order to resolve them as soon as they are spotted. The smart use of recruitment analytics saves a lot of time and money in helping managers make better-informed talent decisions or track employees’ performance. While there are many types of dashboards, here is a recruitment dashboard example that you can use to visualize the main KPIs related to your recruiting funnel:

**click to enlarge**
Data is a very powerful tool for human resources during the hiring process when you leverage recruiting metrics on your online dashboard. The days when you needed to take lengthy amounts of time to hire employees for your organization based upon limited information are now over.
As a data-driven organization, you can measure a variety of factors that can help in the recruiting process, and in order to do that, you can use your recruitment dashboards to better read key performance indicators (KPIs), and evaluate the effectiveness of your recruitment process.
**click to enlarge**
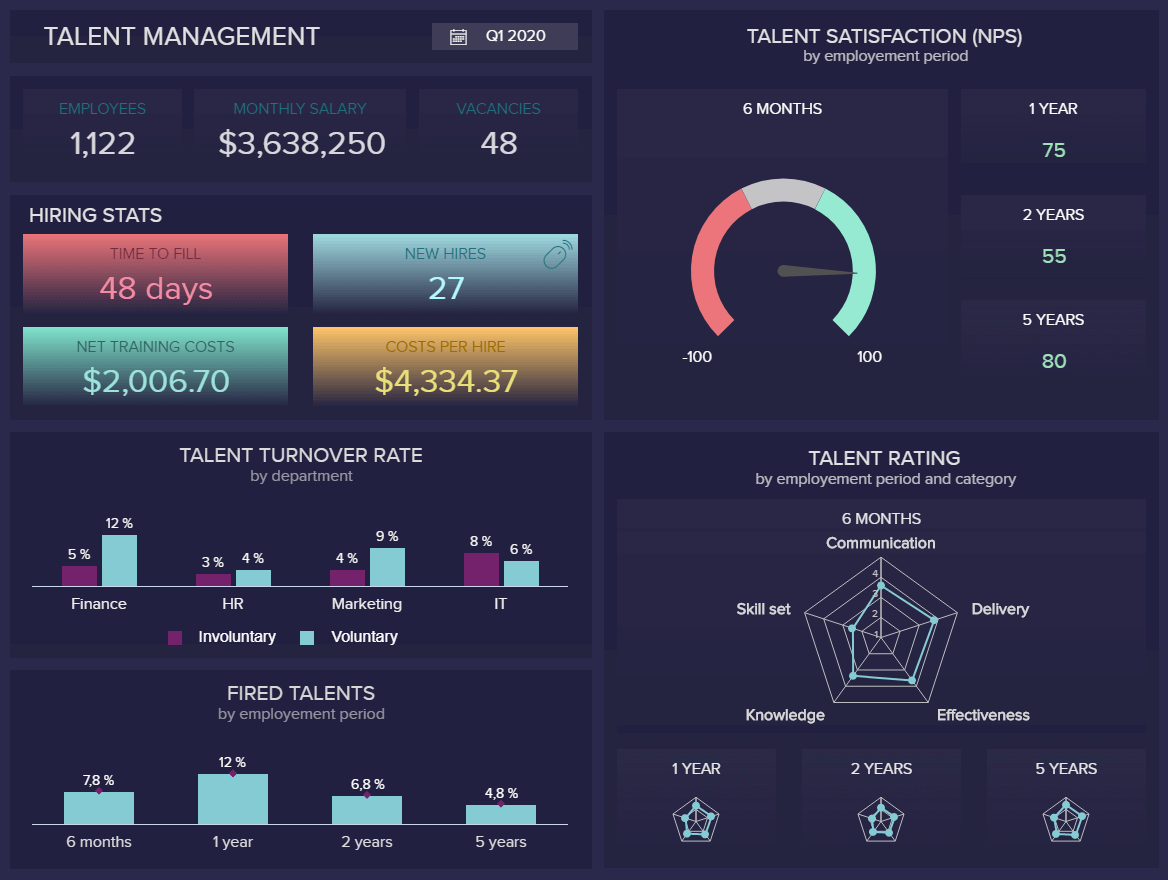
In addition to using data to attract new recruits to your business, HR managers can also use visual dashboards to manage their existing talent.
Our talent management dashboard above, for example, offers all of the tools to keep your employees engaged, and motivated. By working with KPIs such as talent satisfaction, talent rating, and talent turnover rate, you can make strategic decisions to improve loyalty while maintaining a consistent level of performance across the board.
Let’s face it, you have to stay competitive in this constantly and swiftly adapting world of data, and in order to do that, you have to hire the best employees, and use the most advanced HR analytics software available that can help give you the extra edge to boost the success rate of your business.
There is a wide variety of recruitment KPI examples that you can use on your dashboard to ease out the recruitment process.
Why You Need to Track Your Recruitment Funnel
It’s clear that recruitment reporting tools are a powerful force. But without accurately tracking your recruitment funnel, your efforts could be diluted and become less efficient in the long run.
As we established, finding the right people for your organization can prove to be a tricky process. That said, your recruitment funnel will help shape your strategies for successful talent acquisition in all departments – from customer services to marketing and beyond.
Although each recruitment funnel differs slightly from business to business, fundamentally, your recruitment funnel consists of:
- Attracting passive candidates for a particular role.
- Setting up the application processes and offering shortlisted interviews or assessments.
- The interviews and assessments of your shortlisted active candidates.
- Hiring or offering the role to the most suitable candidate.
- Acceptance and onboarding.
By tracking each stage of the funnel with the help of a dynamic recruitment funnel dashboard, you’ll be able to streamline every stage of the process, keeping your candidates engaged throughout, ultimately sourcing the best possible person for the role. In turn, this will fuel organizational growth, ongoing development, and an increase to your bottom line.

**click to enlarge**
This particular recruitment funnel template above offers a comprehensive insight into each stage of the hiring process, providing key data on elements – such as the length of particular stages or cycles of the operation – while delivering metrics on the level of activity at each stage of the recruitment funnel.
This information is invaluable as it will help busy modern businesses continuously improve and enhance their overall hiring strategy, cementing a sustainable level of success. And in today’s digital age, constant improvement and evolution are vital – especially concerning talent acquisition.
Now, let’s take a look at some of the most valuable metrics that can be used in your recruitment BI dashboards so that you have the right tools for your specific questions and areas of interest in the hiring process for your business.
Our Top 16 Recruitment Metrics & KPI Examples
Now that we’ve explored a recruitment funnel template and looked at every key facet of recruitment reporting, it’s time to get under the skin of the recruitment metrics examples that will ensure your HR and recruitment initiatives are optimized for the level of sustainable success that will propel your organization to the next level.
Let’s start with recruitment & hiring performance metrics.
First, we’re going to look at the recruiting KPIs you would typically find on a hiring dashboard. These essential insights are designed to reduce inefficiencies while streamlining the hiring process.
1. Offer acceptance rate (OAR)
Your OAR is one of the most important talent acquisition KPIs, as it will demonstrate your ability to understand your candidates’ preferences and priorities.
If your OAR is consistently high, it’s a clear indication that your job specs are transparent, your hiring process is fluid, and you are taking measures to tailor your offers to meet candidate needs as well as expectations.
If your OAR isn’t measuring hiring success, by analyzing trends and patterns, you will be able to get straight to the root of the issue and take strategic action to improve your communications, job spec messaging, and overall candidate experience. As a result, you will attract consistently high-quality talent to your business while improving your employee retention rates across the board.
In summary, if every aspect of your candidate experience is cohesive and informative, you will make it easier for potential talent to get on board with your company culture, developing a sense of motivation and loyalty before the end of the process. In that sense, OAR is one of the most essential recruitment reporting metrics for any hiring or HR department.
2. Candidate experience
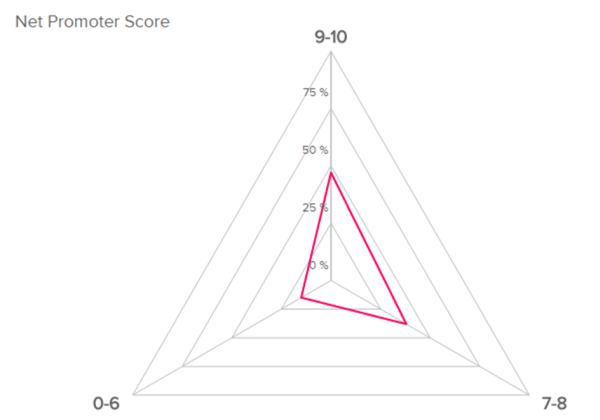
Much like net promoter score metrics are pivotal to keeping your existing talent happy, engaged, and motivated, NPS-style KPIs are also incredibly effective for the candidate experience.
In addition to OAR, candidate experience NPS metrics will empower you to drill down into specific areas of your recruitment process by understanding the overall satisfaction levels of your candidates.
Using a recruiting metrics template to quantify your candidate experience NPS will offer the level of insight you need to optimize specific areas of your hiring journey – from initial application and first interviews to assessments, digital communications, and beyond.
To demonstrate the value of using NPS scores to benchmark your candidate experience initiatives, you can simply use this metric to gain at-a-glance access to the success of your talent satisfaction from a recruitment perspective.
To gather clean, reliable data for recruitment analytics metrics of this variety, you can also adjust this metric and ask your candidates to rate their overall experience from one to ten (to identify your percentage of Promoters, Passives, and Detractors) while asking for specific feedback.
This powerful mix of qualitative and quantitative data will paint a panoramic picture of your candidate engagement efforts across touchpoints, giving you the intelligence you need to continually adapt to the landscape around you.
3. Time to fill
Time to fill metrics promote stability within your organization. It measures the amount of time it would take to locate and hire a potential new employee. The process begins with a requisition being approved by a company and extends to the point when the candidate has completed the necessary background checks. Essentially, it gives managers the opportunity to understand how long it takes to fill a job position.
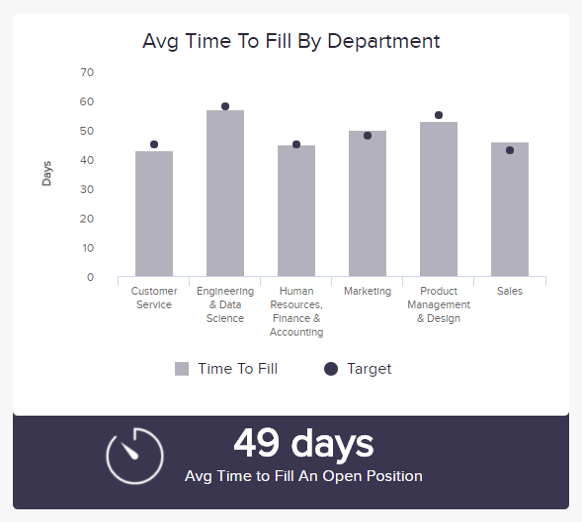
This is important because hiring employees can often be a lengthy process involving multiple steps. The most successful organizations want to take measures that will considerably reduce their HR KPI ‘time to fill’ figure while keeping a good quality of hire at the same time – otherwise, this is time wasted.
4. Quality of hire
This recruiting metric basically indicates whether the person who was appointed to fill the position is good or bad for your organization.
It is generally used to measure the performance of a hire during a 1-year time period. Low ratings can indicate bad hires, and this can cost companies a substantial amount of money. Knowing exactly how your employees are helping your organization and what skill sets they’re bringing to their job, is integral.
5. Source of hire
How do you know where to look when hiring the best talent for your organization? Well, the smartest recruiters use the source of hire. Candidates are using lots of digital channels to research and find your company. So it only makes sense that the smartest recruiters use multiple channels, whether it’s LinkedIn, advertisements, and social networks.
How do you know which of these channels is the most effective? You visualize the sources of hire on your recruitment digital dashboard. It indicates information such as:
- The number of applicants that are originating from each source.
- Of all the applicants that came to the specific channel, how many were qualified?
With this operational KPI, you can better understand your recruiting expenditures, and stop using channels that are not bringing in interested candidates, which will save you some money. Likewise, you can spend more money on the channels that are actually bringing your organization the most interested, qualified people who are looking to be a part of your company.
6. Source of channel efficiency
Expanding on our previous point, source of channel efficiency is one of the recruiting metrics KPI that will help you evaluate the success and efficiency of your main candidate hire sources.
By identifying and analyzing your primary hiring sources, you can use the source efficiency metric to understand which sources convert the best-quality candidates and which ones need work.
Once you’ve gained an insight into candidate source quality, you can take definitive measures to place additional investment into the hiring channels that are performing well while optimizing the weaker touchpoints to improve your messaging and attract a wider range of talented candidates – all while driving down recruitment costs.
7. Cost per hire
Understanding how much money you are spending during the recruitment process can be a very efficient way to allocate spending. It’s important to look at all of your costs when hiring an employee so that you can learn where you can cut costs during the hiring process without affecting the candidate’s quality or experience level.
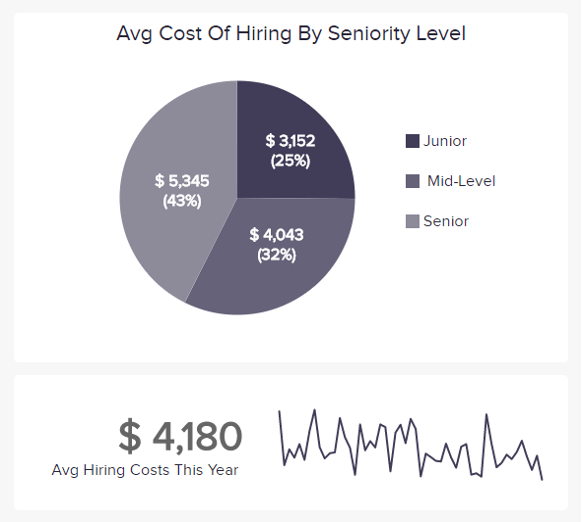
Here are some of the factors that the HR metric ‘cost per hire’ helps discover:
- Recruitment time costs
- Costs of managers and employees that are involved in the hiring process
- Administrative costs that are linked to the process of training and implementing new employees
8. Applicants per opening
This is a great metric for measuring job popularity. But just because a lot of people are applying for your job does not necessarily equate to something that’s positive for your company. It could indicate that the job description is too vague, for example.
But this metric can also give you a great starting place to begin narrowing down your job description while still maintaining that suitable candidates are applying for this position, even if fewer people are applying for that particular job.
These valuable KPIs will help you drill down into human resources metrics and hiring practice. Tracking these insights frequently will give extra depth to your overall recruitment strategy, ensuring it remains cohesive and productive at all times.
9. Hiring manager satisfaction
This is an interesting metric that you should include because you want to be able to understand how satisfied your managers are in relation to employee performance. Again, you can measure this by using a net promoter score (NPS) approach:
If your managers are satisfied, it implies that the candidate fits well within the team, which is an indication of a successful hire.
10. Recruitment funnel effectiveness
Circling back to the recruitment funnel, this effective recruitment dashboard component offers an incredibly focused means of analyzing the effectiveness of every stage of your hiring journey – insights that surpass the processes from the candidate’s perspective alone.
As the digital age continues to shift and change, so do the dynamics of the hiring process. With more touchpoints, tools, and candidate assessment methods available than ever, gaining a panoramic insight into every effort and initiative is essential. The recruitment tunnel effectiveness KPI will help you do just that.
One of the most useful insights served up by this recruiting metrics dashboard KPI is the yield ratio per step – a calculation based on the number of applicants that have successfully completed each stage of the funnel over the total number of applicants that entered the stage.
By understanding this metric, you’ll learn where you need to refine your efforts for maximum recruiting success.
11. Recruiting conversion rate
Conversions are essential to determining the overall success of your efforts in a wide range of business-related areas, such as marketing and sales. And again – recruitment is no exception.

This particular part of a recruiting metrics dashboard is an essential HR performance indicator as it hones in on the performance of your internal human resources executives as opposed to solely focusing on potential employees.
Last but certainly not least, these recruiting metrics are focused on keeping your staff motivated, content, and productive across the business.
12. Talent satisfaction
In many ways, your talent is the backbone of your entire business. Without an engaged, motivated workforce, your productivity and progress will dwindle.

As one of our most powerful talent acquisition metrics, this employee-centric NPS-style KPI will empower you to create a culture that keeps your talent satisfied at all times. By conducting frequent employee satisfaction surveys and using this dynamic recruitment KPI to benchmark your business’s overall satisfaction levels, you can take direct strategic action to ensure your employees feel valued, engaged, and motivated in every key aspect of their working lives.
13. Candidate job satisfaction
How much does the job description match with what a new employee is experiencing in the workplace? This metric measures employees’ expectations with their job satisfaction and can determine a realistic job preview. This helps to put into perspective the experience that your employees are having with your organization.
This KPI recruitment dashboard metric is not only pivotal for understanding the quality of your candidate experience. This invaluable talent-centric data can also help you gain insights that you can apply to your ongoing talent satisfaction strategies.
14. Employee turnover rate
As one of the most powerful metrics for recruiting, your employee turnover rate will give you a comprehensive insight into how your staff retention efforts are working.
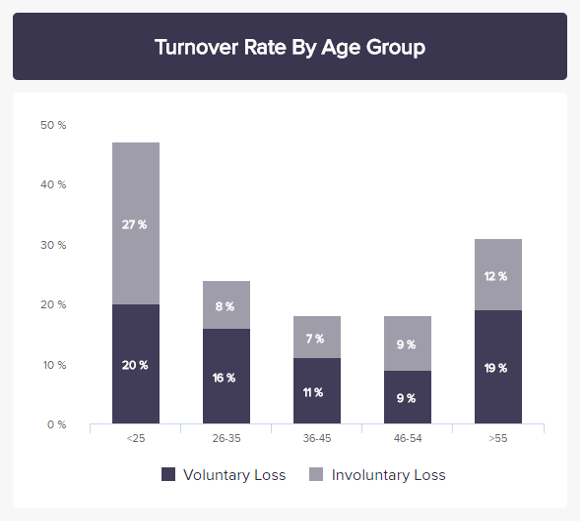
Our employee turnover KPI is presented in a digestible bar chart format, offering a quick-glance insight into the percentage of voluntary versus involuntary turnover over a specific time frame. By tracking this talent acquisition dashboard metric regularly, you will be able to create an effective talent replacement plan in the event your retention rates drop.
Through frequent monitoring, you can get to the root of any staff turnover issues and make strategic decisions that will encourage staff loyalty and drive your turnover rates down.
15. First-year attrition
The insights featured here are great metrics and analytics in recruiting for measuring hiring success. First-year attrition can be broken down to be either managed or unmanaged, which means that the contract is either terminated by the employer, or the employee leaves the company.

It could indicate that the job description did not meet the expectations of the candidate, or that the candidate did not fit well within the team.
16. Female-to-male ratio
Did you know? Gender diversity in the workplace is still a pressing issue. While we’ve come a long way in recent years, many sectors are seriously lacking in female talent – and to their detriment.
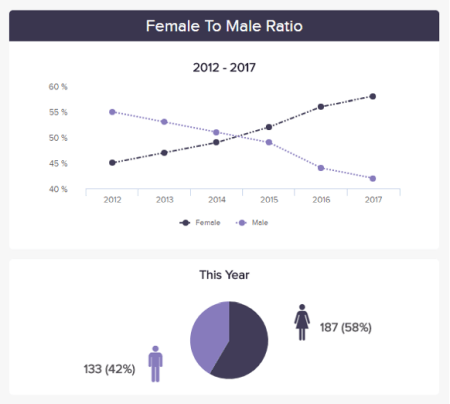
There are many benefits of having a fair, equal, gender-diverse workforce. If your workplace is imbalanced, this essential recruitment analytics KPI will help you make the kind of positive changes that will make your business better.
While this metric largely depends on candidate availability, by utilizing it to your advantage, you will be able to keep track of gender equality in your workplace and provide your recruitment staff with the information they need to attract a wider range of diverse talent. This recruitment-based KPI will thrust your business towards a brighter, more prosperous future.
Now that we have included the top metrics you need to have for creating a powerful HR analytical report, we will delve into the topic even deeper. That said, we will discuss 5 important tips to create your first recruitment report and provide you with a roadmap that you can follow.
“Being a great place to work is the difference between being a good company and a great company.” – Bryan Kristofek
5 Tips to Create Your First Recruitment Report
A recruiting metrics dashboard is a powerful tool. If designed the right way, your recruiting metrics dashboard will help accelerate your company’s hiring efforts almost immediately.
To steer you towards recruitment reporting success, here are five essential steps to consider:

1. Collect and curate your data
Before you start to physically compile your first recruitment report, it’s vital to collect all of the data that you believe is relevant to your efforts, strategies, and initiatives. Once you’ve identified your potential data sources, you should examine each metric and omit any information that you deem to be surplus to what’s required. Your ‘cleaned’ and curated data will form the foundations of your HR analytics report.
2. Set your primary recruitment aims
Once you’ve cleaned and curated your data, you will have the direction you need to define your primary (or broader) recruitment aims and goals.
While “improving your recruitment efforts” is undoubtedly your main aim, it’s important to consider what your business needs to do to make it happen from a hiring and recruitment perspective.
For inspiration, your primary recruitment aims, or pillars, might be:
- We want to improve the return on investment (ROI) of our digital job board advertisements.
- We want to make the candidate experience better from a digital perspective.
- We want to reduce our staff turnover rate by engaging our existing employees and hiring better, more relevant candidates for our vacancies.
- We want to reduce our annual recruitment spend by a specific percentage.
These examples give you an idea of broader recruitment strategy aims. Once you know what you’re aiming for, you can refine these goals by taking the next step in the process.
3. Select the right KPIs
Remember – setting the right goals and targets is essential to recruiting analytics success. Once you’ve taken measures to curate your relevant data and set measurable hiring goals in a collaborative environment, you can use your KPIs to drill down further into your aims.
Armed with your primary aims and goals, you will be able to choose the right KPIs to help you track, measure, and monitor your efforts with pinpoint accuracy throughout the entire hiring journey and recruitment funnel. Doing so will ensure your data dashboards are optimized for success, covering every key aspect of your hiring and recruitment strategy.
For inspiration, check our guide on our most relevant HR-based KPIs and how to implement them into a comprehensive HR report.
4. Consider your audience
Before you create your recruitment report in full, take a moment to consider who will need to use or extract information from it. Will it be aimed at a particular campaign or department? Will you be presenting your data to senior executives? Will internal parties need to gain access to your reports? Take the time to answer these questions. For inspiration on how to communicate your information to others within your organization, explore out our guide to selecting the right data visualization types.
5. Use interactive dashboards
Armed with your information and neatly curated data, you should work with an interactive dashboard to create a report that will get real results. The best interactive dashboards are intuitive, easy to navigate, completely customizable, and present all of the insights you need in one central location. If you’ve completed steps one to three, selected the right KPI dashboard software, and taken the time to get comfortable with it, compiling your report will be easy, and everything will fall neatly into place. The best thing is – if you need to make tweaks or changes, you’ll be able to do so at your leisure.
Summary & Next Steps
Here is a summary of all the recruitment metrics we have discussed:
- Offer acceptance rate
- Candidate experience
- Time to fill
- Quality of hire
- Source of hire
- Source of channel efficiency
- Cost per hire
- Applicants per opening
- Hiring manager satisfaction
- Recruitment funnel effectiveness
- Recruiting conversion rate
- Talent satisfaction
- Candidate job satisfaction
- Employee turnover rate
- First-year attrition
- Female-to-male ratio
In the end, data and analytics tools are rapidly evolving. Technology and data are changing the way businesses develop strategies that impact their success. These tactics extend to recruitment strategies that are formulated around this constantly adapting world of data. In order to create the kind of intelligent, reliable strategies that are impacting the future of businesses, HR departments and managers are turning to recruiting KPIs.
“If you think hiring professionals is expensive, try hiring amateurs.” – Anonymous
We live in the age of information. Now that it’s possible to utilize recruitment analytics by embracing the power of dynamic recruitment KPI dashboards, you can take charge of effectively hiring new employees, measuring employee satisfaction, allocating hiring process costs with intelligence, and understanding your candidates’ application motivations.
To squeeze every last drop of value from your KPIs, you need real-time recruitment dashboards that will improve your recruitment-based business intelligence solutions and, ultimately, push you ahead of the pack. Now is the time to strike.
Now that you understand the power of metrics and analytics in recruiting, it’s time to try datapine’s free trial and take that first big step towards business intelligence enlightenment.
The post How Recruitment Metrics & Dashboards Can Help Improve Hiring New Candidates appeared first on BI Blog | Data Visualization & Analytics Blog | datapine.