
To succeed in today’s competitive business world, the ability to make the right decisions at the right time based on water-tight insights is essential. If you don’t have the vision or don’t know what to do with it, you’ll find yourself shooting in the dark – and that is detrimental to the growth and evolution of any business, regardless of size or sector.
Studies suggest that businesses that adopt a data-driven marketing strategy are likely to gain an edge over the competition and in turn, increase profitability. In fact, according to eMarketer, 40% of executives surveyed in a study focused on data-driven marketing, expect to “significantly increase” revenue.
That said, if you’re looking to evolve your empire, increase brand awareness, and boost your bottom line, embracing business performance dashboards and big data should be at the top of your priority list. And we’re not just talking about marketing, but all your business’ bits and pieces should embrace the power of modern data analysis and utilize a professional dashboard creator that will enhance your data management processes.
Still unsure? Not to worry – we’ll not only explain the link between big data and business performance but also explore real-life performance dashboard examples and explain why you need one (or several).
Download our pocket-sized summary and improve your operations!
The Link Between Data And Business Performance
In today’s information-rich age, there is a tangible link between online data analysis and business performance. By harnessing the insights, information, and metrics that are most valuable to key aspects of your business and understanding how to take meaningful actions from your data, you will ensure your business remains robust, resilient, and competitive.
All areas of your modern-day business – from supply chain success to improved reporting processes and communications, interdepartmental collaboration, and general organization innovation – can benefit significantly from the use of analytics, structured into a live dashboard that can improve your data management efforts. According to Accenture, 89% of business innovators believe that that big data analytics will revolutionize business operations in the same way as the World Wide Web. Moreover, 57% of enterprise organizations currently employ a chief data officer, another study conducted by MicroStrategy.
You need to monitor your business performance and derive actionable insights. If you fail to do so, you risk damages in your productivity and costs. With the competitive market that your company faces, that can only bring danger to shut down your operations. That kind of gamble is not the path of success. You need data-driven decisions, and a dashboard for business performance will make sure you reap the best possible rewards.
It’s clear that big data, if used to its full potential, has the power to improve your organization’s operations and initiatives exponentially, and a performance dashboard is pivotal to squeezing every last drop of value from the data before you.
But before we delve into examples and templates of these kinds of dashboards, we will focus on our next subject: what is a business performance dashboard?
What Is A Performance Dashboard In Business?
A performance dashboard is a data visualization tool that offers a wealth of knowledge on invaluable insights, enabling the user to gain a deeper understanding of their business’s performance in a number of areas while making valuable decisions that foster growth.
A product performance dashboard offers a wide range of information in one central location, allowing organizations to drill down into important product metrics and key performance indicators (KPIs) without the need to log in to separate tools or platforms. It helps to easily spot the overall performance of product lines and adjust the quality, development of new products, and evaluating existing ones.
Business performance dashboards assist in the cohesive rather than fragmented analysis of critical datasets, which ultimately results in sustainable commercial success in a competitive digital landscape.
The vast majority of business dashboards offer a customizable interface, a host of interactive features, and empower the user to extract real-time data from a broad spectrum of sources. This level of functionality presents a significant advantage over static dashboards, making business performance dashboards a key component to improved business intelligence (BI).
Key Benefits Of Performance Dashboards
Now that we’ve answered the question – what is a performance dashboard? – it’s time to explore the invaluable benefits of using these kinds of intuitive, interactive analysis tools and platforms.

1. Instant insights
Rather than having to wait days, weeks, or months for data reports, modern dashboards offer access to critical data-driven insights almost instantly. Moreover, a dashboard of this kind also provides a panoramic view of real-time information, allowing key stakeholders within the business to make swift decisions that will ultimately save time and money. Your dashboard doesn’t need to freeze in time. You have the possibility to look at the data immediately, set refresh intervals and let the software do the arduous work.
2. Increased efficiency
By gaining access to detailed sets of visually digestible information from one central location, you’ll be able to make more informed decisions on a regular basis. Over time, this will result in an overall improvement to your business’s efficiency in the areas that matter most. Everyone in your team or important stakeholder can explore data on their own without the need to copy or send numerous files. You access only one location where you look for insights, reports, analysis, and monitor your performance. That way, the whole company can benefit from increased productivity
3. Progress monitoring
By setting KPIs that align with your business’s goals, aims, and aspirations, you’ll be able to evaluate your progress accurately and understand whether you’re meeting important milestones. And if you’re not, your dashboard will offer a wealth of insight into ways to make improvements that will help you do so. Choosing the right KPI is a different topic but you need to keep in mind to focus on a few that will drive actions towards improving your performance.
4. Interactivity
How many spreadsheets have you scrolled upon and lost hours of work in searching for the right information? With the help of business intelligence dashboards, you won’t need any manual work except utilizing numerous interactive features within your screen; from drill-downs to dynamic text boxes and images – no business question will remain unanswered. You can easily filter your dashboard with just a few clicks and immediately find the information you were looking for, without scrolling or manually calculating your data.
5. Access 24/7/365
The online nature of company performance dashboards enables you to have access to your data no matter the place or time, you just need Internet connectivity and you can log in to your account from a mobile device, desktop or laptop. The development of cloud technology provides you with a secure data storage area where you don’t need special IT knowledge, the vendor takes care of updating and managing the software. Your IT department can focus on other important tasks while your data management and performance monitoring can be done by everyone in the company, no matter where they’re located.
6. Intelligent reporting
You need to report on your performance, no matter the industry or department you’re a part of. A business development dashboard ensures your reporting is on schedule each week, month or any time interval you set while the data updates itself and you don’t need to think about writing numerous Word files, Excel sheets or creating a PowerPoint presentation. You can share the report internally or externally, set groups of recipients or give viewing rights to specific users. The automation will do the rest. You can explore numerous business report examples that can show you how to develop and set up a proper report structure.
7. Predicting the future
When you need to secure a beneficial and positive performance for your business, a business performance management dashboard will obtain advanced features such as predictive analytics. Often times, statistical analysis is done manually and takes a lot of business hours to complete and provide recommendations for the future. But what if you have the possibility to let the software do the calculations based on your inserted data points and utilize the forecast engine that will visualize your performance for the next time period? It seems like a question from the future but today that’s more than possible.
8. Smart alarms
Another benefit you can take full advantage of is the intelligent data alerts feature that dashboards of this kind will have incorporated. With neural network alerts and pattern recognition, you will get automatically notified when a business anomaly occurs, keeping your performance on a top-notch level and enabling you to act as soon as possible. That way you can easily focus on other tasks while the company performance dashboard will alert you if something happens.
Download our pocket-sized summary and improve your operations!
Now that we have defined what is a performance dashboard and explored the main benefits they could offer; we will take a closer look into industry examples and templates which you can implement into your own company.
Business Performance Dashboard Examples
Another notable benefit of business performance dashboards is their self-service nature. Accessible, intuitive, and easy to navigate, it’s possible to use these invaluable online BI tools to their fullest potential without the need to rely on developers or technical staff.
To put this notion into a living, breathing perspective, here are performance dashboard examples for your browsing pleasure.
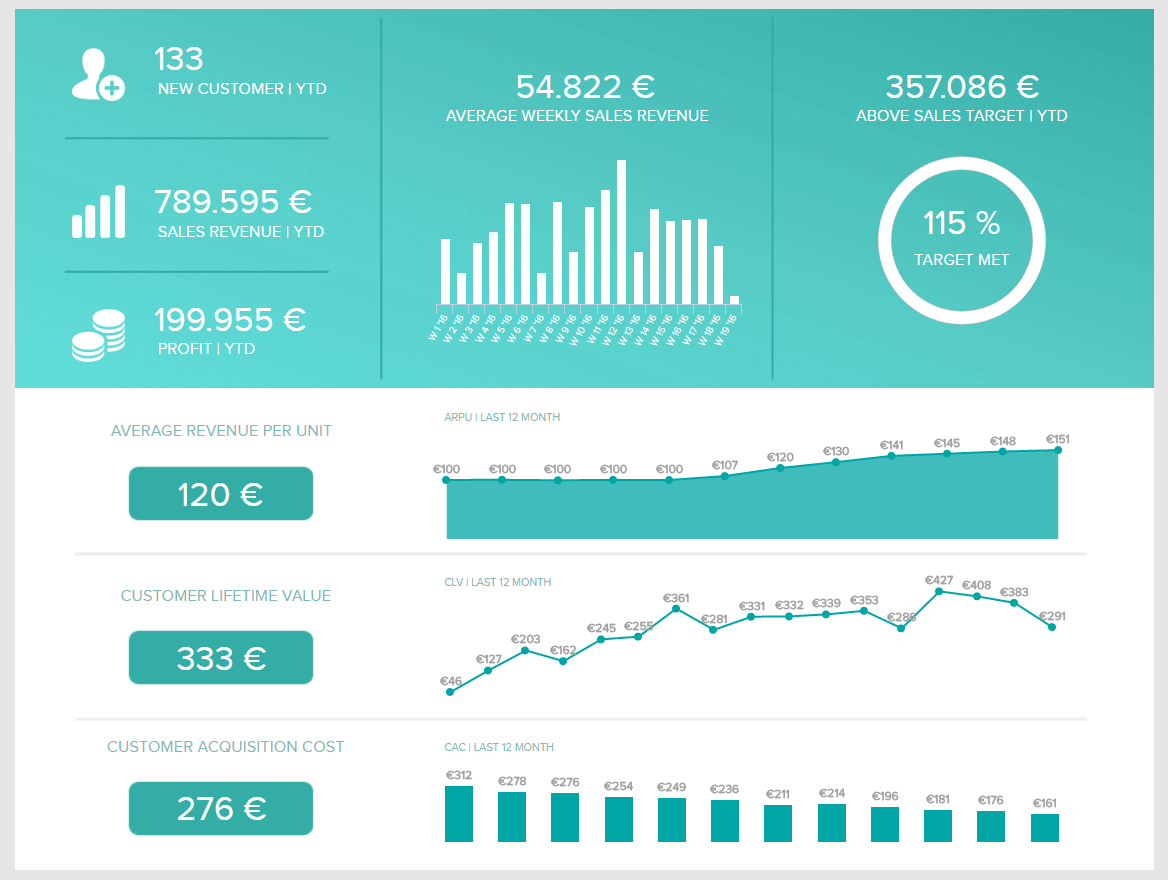
1. Sales Performance Dashboard
Focusing on sales growth and profitability, this sales dashboard provides a panoramic overview of the sales department’s progress by drilling down deep into sales KPIs such as sales targets, ARPU (average revenue per unit), CAC (customer acquisition cost), and CLV (customer lifetime value).
**click to enlarge**
One of our most valuable performance dashboard templates, this is essentially a one-stop-shop for the sales insights that will help you iron out inefficiencies, enhance the performance of your sales team, and boost your profitability on a sustainable basis.
The goal here is to increase customer lifetime value and average revenue per unit or user/account while driving down acquisition costs – and the metrics served up here will help you meet these goals and maintain them over time. This example shows how the performance of the sales department can be viewed through a strong pipeline created with a simple dashboard. Whether you need to monitor performance on a weekly or strategic level, this kind of a representation of data will ensure you stay focused on your most important KPIs, as mentioned. Moreover, you will visually see what happens and what can happen when you start interacting with your online data visualization creation that will, ultimately, secure top departmental performance.
Primary KPIs:
- Sales Growth
- Sales Target
- ARPU
- Acquisition Cost
- CLV
For more information on these business performance dashboard examples, explore our full range of sales dashboards.
2. Marketing Performance Dashboard
One of our pivotal marketing examples, this performance dashboard template has proved to be the beating heart of many successful organizations.
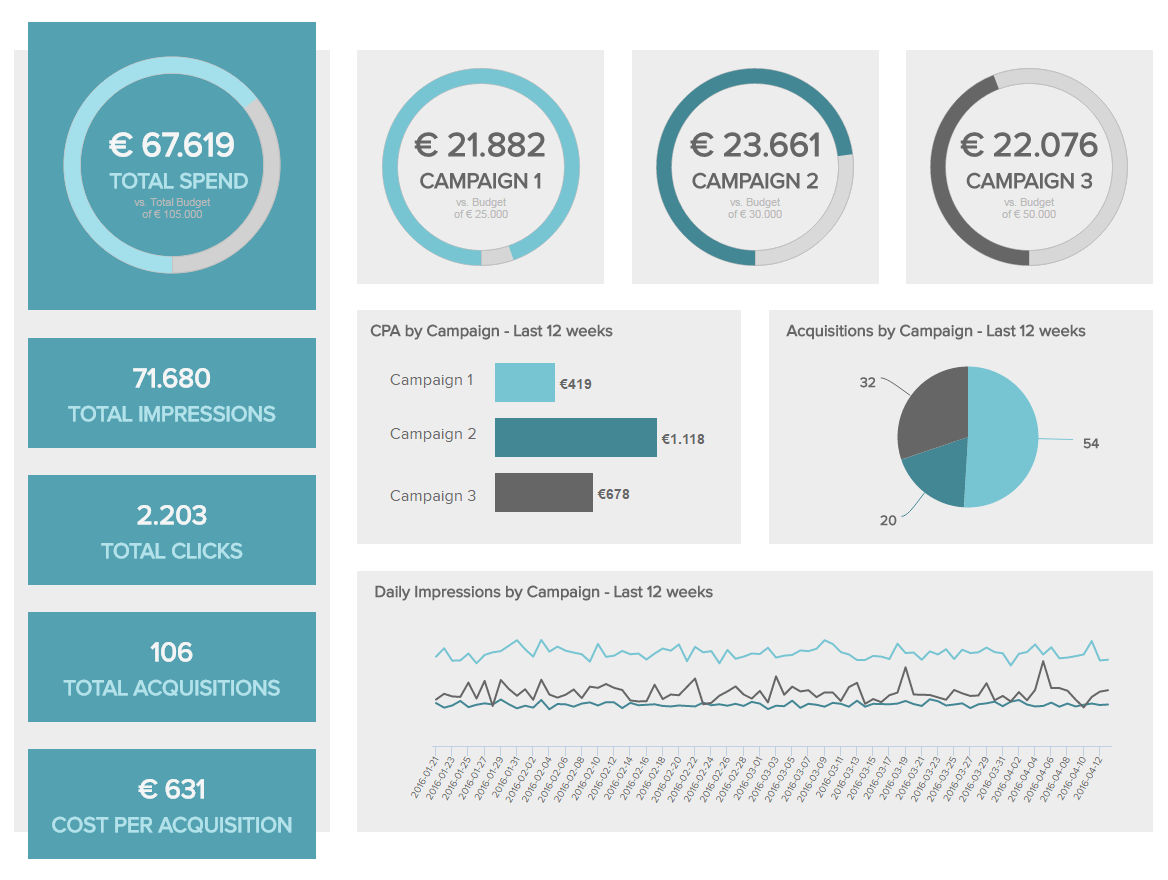
**click to enlarge**
Offering a comprehensive level of insight into critical marketing performance data across a multitude of marketing channels and campaigns, the dashboard will help you to create detailed marketing reports, and enjoy a maximum ROI for every one of your business’s promotional efforts. You can clearly see the general overview followed by the specific performance of each campaign you have launched. By gaining this wealth of knowledge in a clear and feasible way you can easily spot which campaign is the best performing one, which channels have the lowest cost-per-acquisition and enable you to think about what steps you can take in your future promotional activities.
By delving into vital KPIs, including click-through rates, cost-per-click, and cost-per-acquisition, this priceless data dashboard will give you a greater understanding of the costs of your marketing efforts in comparison to your actual costs. Plus, metrics like click-through-rate will also help you gauge how engaging or effective specific marketing initiatives are, allowing you to make the tweaks necessary for optimal promotional success.
Primary KPIs:
- Click-Through-Rate (CTR)
- Cost-per-Click (CPC)
- Cost-per-Acquisition (CPA)
For more information on these business performance template examples, explore our full range of marketing dashboards.
Download our pocket-sized summary and improve your operations!
3. Financial Performance Dashboard
The finance department of any organization, regardless of industry or sector, is vital to sustainable success and economic fluidity. This financial report example offers a robust snapshot of your company’s capital structure in addition to how your existing assets are being managed.
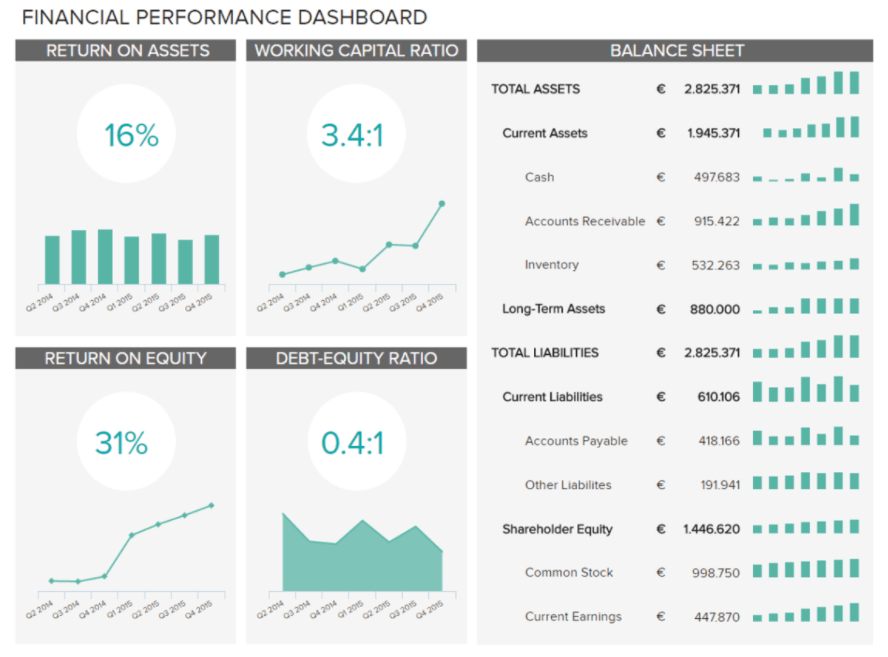
**click to enlarge**
This essential product performance dashboard template closely monitors the two ratios (return on assets and return on equity) that will ensure you maintain control of your organization’s financial health on a continual basis, which, in turn, will not only help the business thrive but also give it the ability to deal with unexpected roadblocks or issues in a professional, productive manner.
The 4 visualizations depicted above prove how simple you can visualize all your company’s performance focused on capital and general overview of the balance sheet. By closely inspecting these crucial financial indicators, you can immediately understand how your company’s assets are managed and adjust your strategies accordingly, if needed.
Primary KPIs:
- Return on Assets
- Return on Equity
For more information on our financial dashboard examples, explore our full range of financial dashboards.
4. Employee Performance Dashboard
It goes without saying (almost): your employees are the very people that make your organization tick, which means monitoring performance in this area is critical to your ongoing commercial success. And this most valuable of business performance dashboard templates will help you manage your staff the right way.

**click to enlarge**
Our HR dashboard example, concentrated on employee performance, offers a host of information into key areas including attendance, productivity, overtime, and training costs. By gaining a deeper level of insight into these aspects of your employee’s performance, you will be able to spot trends, identify inefficiencies, and increase engagement where it might floundering. For example, you can indicate the level of motivation and engagement of your workers based on the absenteeism rate, and follow the numbers into the course of 5 years, as presented above. Additionally, you can measure employees’ productivity levels and tailor this indicator to your specific business needs such as letting people set their own working hours that will help them be as productive as possible.
With this online dashboard, you will gain the power to motivate and inspire your employees, provide training support in the right areas of the business, boost morale, drive down operational costs, and make strategic choices that will benefit both you and the people working within your organization.
Primary KPIs:
- Absenteeism Rate
- Overtime Hours
- Training Costs
- Employee Productivity
For more information on our employee performance, explore our full range of HR dashboard examples.
5. Support Team Performance Dashboard
Another crucial part of a successful business is the support team. That’s why a complete Zendesk dashboard will provide you with invaluable data on your team’s performance and give you instant insights and ideas on how to improve.

**click to enlarge**
Metrics such as the net promoter score, first contact resolution rate, occupancy rate, and top agents will ensure you monitor, visualize and analyze your performance in all relevant aspects of support operations that will improve your bottom line.
It is not a secret that customer service is the face of the company that needs to have a top-notch performance to be able to deliver results, ensure efficiency in utilizing call center KPIs that will, ultimately, increase profits. We can see in our example the first contact resolution rate that needs to be closely monitored alongside the average resolution and occupancy rate to see how they correlate and influence customer satisfaction. On the right side, we can see the top performing agents, an important indicator to see how your employees perform regarding the ticket status. When you identify these agents, you can also ask for additional education for each member of your department to see how to improve and implement their knowledge.
Primary KPIs
- Top Agents
- First Contact Resolution Rate
- Utilization Rate
- Net Promoter Score
6. Hospital Performance Dashboard
Improving the clinical and financial performance of a hospital is one of the top priorities in this important industry. A dashboard depicting crucial metrics such as the average length of stay, average nurse per patient ratio and treatment costs will enable you to take full control of your hospital performance and ensure you can offer the best possible care to current and potential patients.

**click to enlarge**
By utilizing healthcare analytics software where you can set your KPIs and create a powerful dashboard, you can optimize your operations and increase the productivity of your hospital. Your patients and staff are the most important part of succeeding in the healthcare industry. You need to keep an optimal number of available staff to take care of patients and make sure you don’t overburden your employees. That way, your hospital won’t face issues in providing the best possible care. Smart alarms and automated reports provided with this dashboard will ensure smooth operational processes and effective hospital management.
By combining all these metrics and interacting with the dashboard, you will be able to monitor each important aspect of your hospital and generate insights instantaneously while keeping a close eye on finances, overall workload of your staff and patients’ satisfaction levels.
Primary KPIs
- Average Hospital Stay
- Hospital Readmission Rates
- Costs By Payer
Download our pocket-sized summary and improve your operations!
Without data, you are just another person with an opinion.” – W. Edwards Deming
Data provides the vision that has the potential to help your business to become more robust, agile, and efficient, and business performance dashboards provide the brain and eyes that will ultimately allow you to process, analyze, and extract the value of that data in a real-world context. In today’s hyper-connected business world, that is priceless. We have seen that in our examples how modern dashboards, created with self-service analytics tools, present data in a digestible format, easy to follow and derive insights that will make your business faster, more agile, and more efficient.
Embrace the power of BI dashboards today, and you’ll reap endless rewards tomorrow. For more insight into using business performance templates and business intelligence to your advantage and starting your journey toward data enlightenment, explore our software for a free, 14-day trial!
The post Get Started With Business Performance Dashboards – Examples & Templates appeared first on BI Blog | Data Visualization & Analytics Blog | datapine.


