
As in many other industries, the information technology sector faces the age-old issue of producing IT reports that boost success by helping to maximize value from a tidal wave of digital data. While integral to organizational success and development, without the ability to gain actionable insights from your most important data, IT reporting could be considered somewhat of a fruitless exercise.
As head of IT, you may have heard the question, “How many support tickets did we get that month? And how fast were they resolved?” Without the capacity to answer such questions, your ability to support your IT department successfully will be hindered.
But in this digital age, dynamic modern IT reports created with a state-of-the-art online reporting tool are here to help you provide viable answers to a host of burning departmental questions. The IT management report of today will help you make more informed, more powerful decisions, do your job effectively, and develop exciting new growth strategies.
To put the power of digital data reporting into perspective, we’ll explore the role of IT reporting, its numerous benefits, and a mix of real-life IT reports examples.
Let’s get started.
We offer a 14-day free trial. Benefit from great IT reports today!
What Is An IT Report?
An IT report compiles an ensemble of IT KPIs tracked over a certain period to assess various situations related to project management, helpdesk issues such as ticket status and their resolution, or more financial-focused costs and revenue stats, among others.
Regardless of their nature, they deliver value to their readers and are supposedly impactful. They have to align with the company’s strategic objectives and priorities, therefore, their realization needs to be thought out. The purpose is not to track every statistic possible, as you risk being drowned in data and losing focus.
By understanding your core business goals and selecting the right key performance indicator (KPI) and metrics for your specific needs, you can use an information technology report sample to visualize your most valuable data at a glance, developing initiatives and making pivotal decisions swiftly and with confidence. By utilizing a modern dashboard creator, each report is easily visualized and provides advanced interactivity possibilities to explore the data and generate insights.
Information technology reports are the interactive eyes you need to help your department run more smoothly, cohesively, and successfully. Now we’re going to look at the reasons why this is the case.
Why Do You Need An IT Report?
When setting up a business strategy for your IT department, you need to craft a vision, identify goals to achieve and a clear path of how to get there. Information technology reports are here to help you demonstrate at each stage of the way where you stand, and demonstrate the progress (or decline) accomplished so far – but also, the effect you have on that progress.
This is why it is highly important to report correctly. If what you are reporting does not align with the wider business objectives, you might end up driving the IT department – and sometimes even the rest of the business – further apart. Bad reporting can also endanger the budget initially settled.
What Are The Advantages of IT Reporting?
IT reporting has many benefits. Not only it lets you assess the current state of activities, to find out what is happening and where, but it also provides you with proof of it happening. Using an IT analytics software is extremely useful in the matter: by gathering all your data in a single point-of-truth, you can easily analyze everything at once and create actionable IT dashboards. Thanks to their real-time nature, you don’t need to struggle with permanent synchronization: all your data is always up-to-date. That is a considerable asset to understand easily the bits and bytes of your activity and turn that data into informed business decisions.
IT reports, visualized through a professional online dashboard, come in handy because they give an idea of the current situation in a glimpse. Just like you would answer “I am a bit stressed” or “tired but happy” to someone asking how you feel, without giving them the blow-by-blow account of everything that happened throughout the week, a report gives a snapshot of the activities. It is a highly effective communication tool to communicate your team’s performance or to collaborate together with coworkers.
To drive home the message of why you need an interactive IT report template and digital dashboard tools for your technical departments, here is a concise summary of the business-boosting benefits:
1. Improved decision-making: The intuitive visual nature of digital reports fosters swifter, more informed decision-making across all key aspects of your IT department. Not only will you be able to make better senior choices relating to your department, but by empowering other members of your team to analyze and drill down into important metrics and insights with ease, you will accelerate your success significantly.
2. Inclusivity: Expanding on decision-making, as these kinds of dashboards and reports serve up digestible data visualizations, members of your IT department will be able to use these reporting tools with ease, even under pressure. The graphical nature of such reports will also make it easy for you and your IT personnel to share data-driven insights with other departments effectively, without any key information getting lost in translation.
3. Agility: As every modern IT report template is fully customizable and offers access to every insight, online data visualization, or KPI from a centralized location across a multitude of mobile devices, it’s possible to gain access to invaluable IT-based information 24/7. As the IT department is the lifeblood of any modern organization, this level of agile access to data will increase productivity and increase response times to unforeseen issues or technical problems.
4. Better business intelligence (BI): By accessing past, real-time, and predictive data with modern BI tools, you will enhance your IT department’s business intelligence capabilities ten-fold – pushing you ahead of the pack in the process. These kinds of reports are designed for growth and evolution, and by embracing them, you will be able to make your IT department stronger than you ever thought possible.
5. Improved productivity and accuracy: In business, it’s critical to provide the right information at the right time. Whether it’s ad hoc reporting in question or strategical analysis and development, the team needs to have access to the right data at any time. By utilizing advanced reporting for IT processes, each team member can have access to data and immediately ask questions, share their findings, and create their own analysis. Moreover, by automating the delivery of reports on specific days of the week or month, productivity increases, and professionals can shift their focus from report creation to actionable insights.
6. Lower costs: Businesses need to lower their costs as much as possible and by creating an IT service report template, you can easily adjust each metric presented and use it for any of your future reports. This will enable you to save time and, consequently, costs that would otherwise be lost in endless static reports and outdated data. Speed is critical, and modern solutions help in centralizing all the information on a single point of access.
7. Confidence: Running an IT department is no easy feat. There are countless things to consider on a daily basis, not to mention long-term initiatives to focus on. With a modern tech report, you can take charge of your data and improve departmental communication. In turn, this will give you greater direction, aptitude, and confidence.
We offer a 14-day free trial. Benefit from great IT reports today!
IT Report Templates And Examples
As mentioned, technical-style reports are composed of a collection of KPIs aimed at analyzing specific parts of the IT department’s activities. Once you have defined what you want to measure, you can select the appropriate metrics and visualize them with an effective dashboard design.
These 3 IT report examples and their associated key performance indicators put the power of information technology-based dashboards into a practical perspective.
Let’s start with our issue management IT report sample.
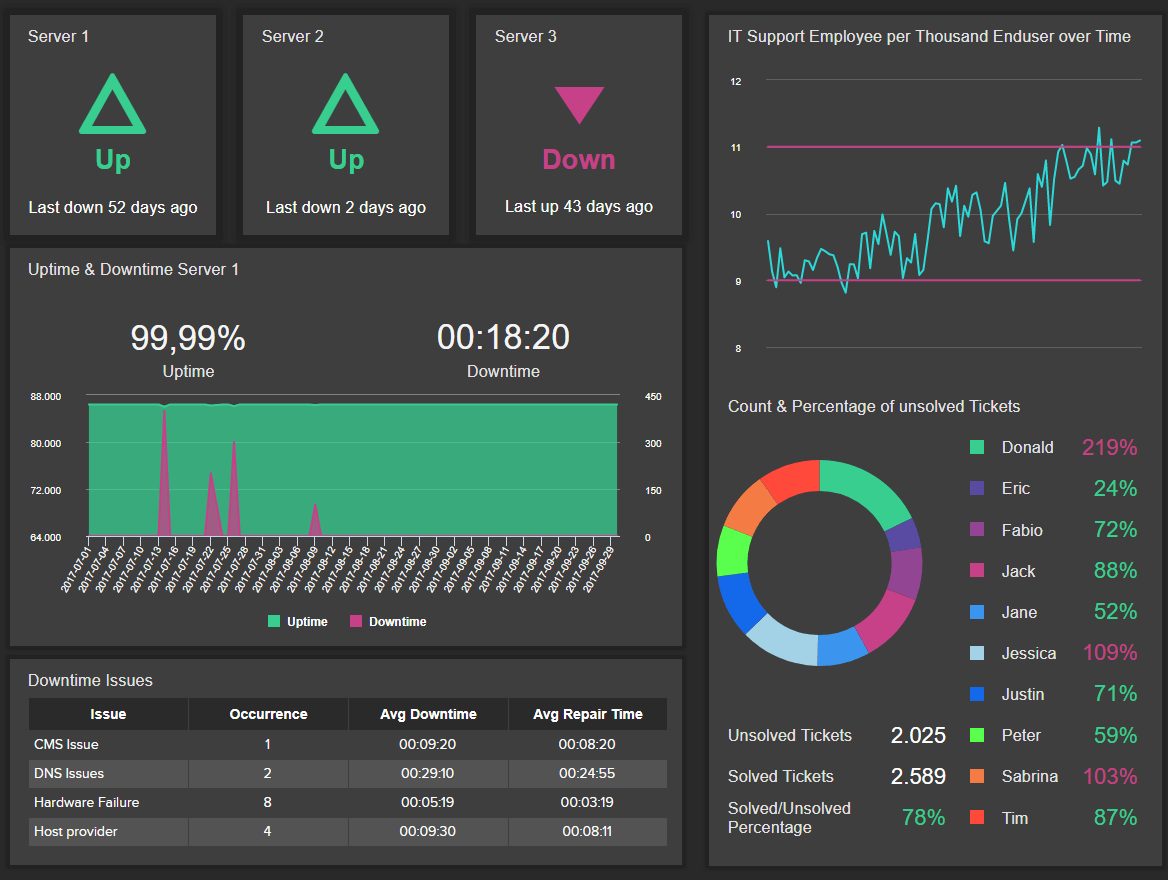
1. IT Issue Management Dashboard
This first IT report template deals with technical issue management and is especially useful for IT leaders.
**click to enlarge**
This particular IT report example indeed provides an overview of the overall problems happening in your system and lets everyone know what is happening and how often. The report displays the performance of 3 servers and tracks several metrics:
- the up- and downtime expressed as a percentage and in minutes
- the types of issue that occurred, the downtime they provoked and the time needed to repair them
- the number of support employee per thousand of end-users
- the percentages of unsolved tickets per support agent
These metrics will help in identifying whether the issues are effectively managed and if the technical performance is on track. The point is to keep the system performance well maintained and such IT operations report template can certainly help in the process. If you spot inefficiencies and higher amounts of issues, for example, from the DNS perspective, or hardware failure, it is time to take a closer look at what happened and why. Another critical point is to look for the IT support employee per thousand end-users over time since it will directly show whether your team needs additional assistance and if hiring new candidates makes sense.
Our next dashboard has a different IT-focus, and that’s related to costs.
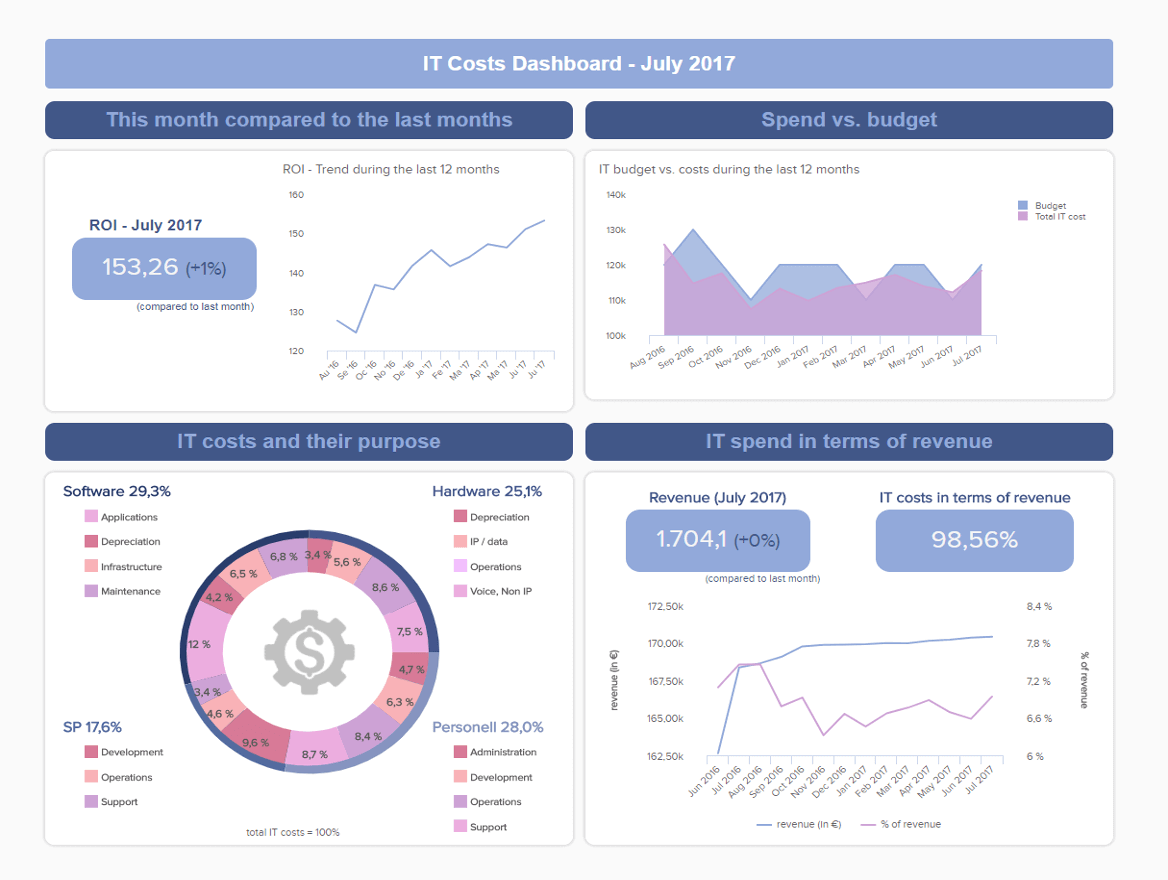
2. IT Cost Dashboard
The second of our IT report examples tackles the financial management of the IT department.
**click to enlarge**
That is a crucial source of knowledge for decision-making as it provides top-management and the financial department with accurate data on how the resources are used, for what, in which quantity, and the profit that you manage to make out of it all. It is split into four different KPIs:
- the return on investment (ROI) over a year, expressing the efficiency of IT investments
- a comparison of the IT spending versus its budget
- a breakdown of all the different costs involved in the management of the department
- a comparison of the costs and the revenue generated
These KPIs are showing a cost-related IT story and can provide you with building blocks for optimizing the current cost management. You can see that the ROI is generally great (more than 150%) and it steadily rises over time, which is the goal of every successful cost management strategy. By monitoring each of these cost-related metrics with the help of online data analysis, everyone in the IT team, finance department and management can have an immediate inside look at the monetary effectiveness of IT projects. That way, potential issues are immediately identified and resolved. For example, if you spot higher costs in your hardware or software section, you can easily investigate what happened and brainstorm ideas to reduce each cost as much as possible. Keep in mind to optimize based on business requirements but don’t cut if there is no need for it or if it will affect the functioning of the IT department.
Our next report goes into detail about project management, critical in modern, technologically-driven companies.
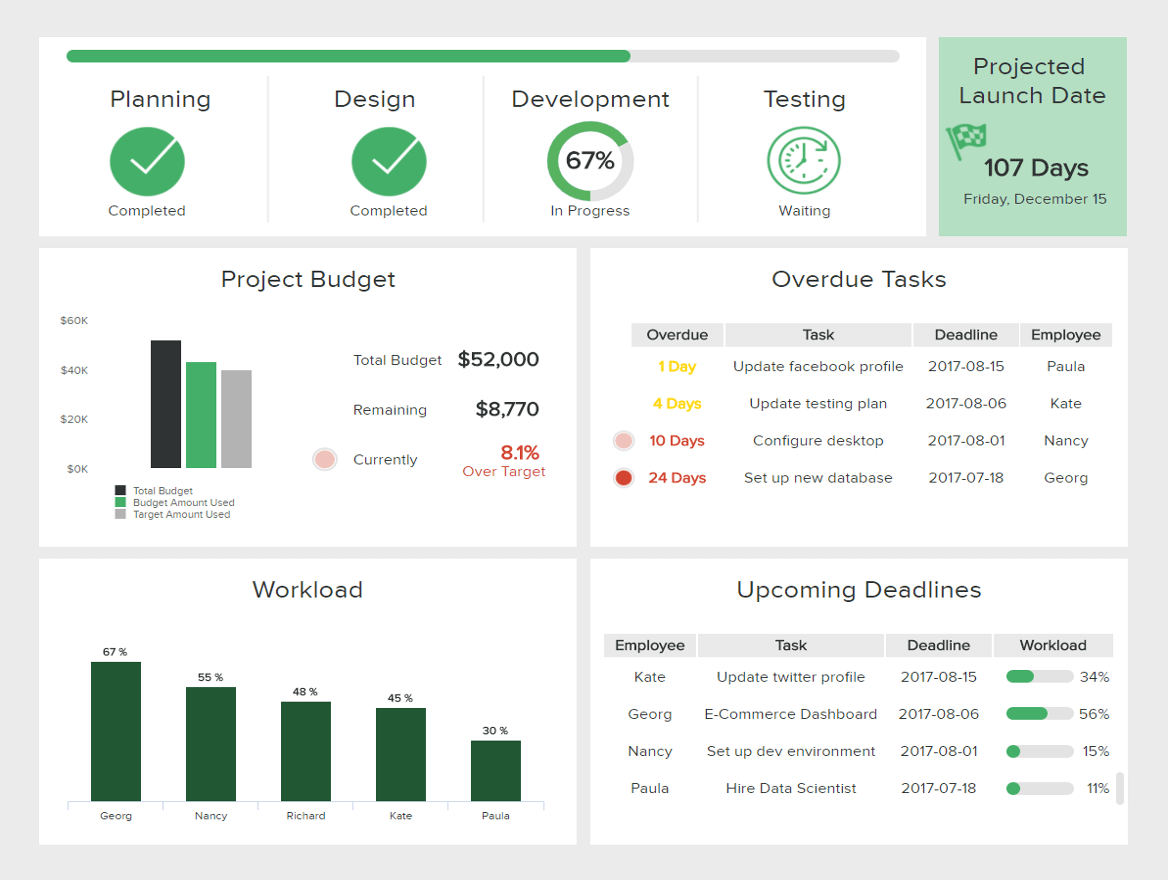
3. IT Project Management Dashboard
Our third report template (excellent for use as an IT department monthly report sample) is an excellent asset when you need the right overview of your IT projects to supervise several activities at once.
**click to enlarge**
It tracks every task necessary to carry out your project, its evolution, where you stand at the moment, what is delayed or needs action. With this IT report example you can find:
- the total project budget compared to what has already been used and what is left
- the overdue tasks, the time-delayed, their original deadline and the employee responsible for the task
- the workload on each employee’s shoulders, directly affecting their capacity to deliver a task on time
- the deadlines upcoming: who is in charge, what type of task, its deadline, and the workload percentage
This type of project management dashboard is specifically developed to accommodate many different IT-related tasks to deliver a successful project. A clear overview of the planning, design, development, and testing alongside the projected launch date will clearly show the stage where the team is currently working, and what kind of tasks and deadlines are overdue or upcoming. The project budget and the workload show a clear overview of the total budget, remaining, and who in the team has time to take on additional tasks and insights into the general organization. These kinds of business intelligence solutions help in optimizing metrics and automating many of the reporting processes. For example, you may notice that the workload of one team member is lower and you have the space to assign to him/her some overdue tasks that have a higher urgency level.
Our next template goes into strategic monitoring and development, useful for modern CTOs and CIOs.
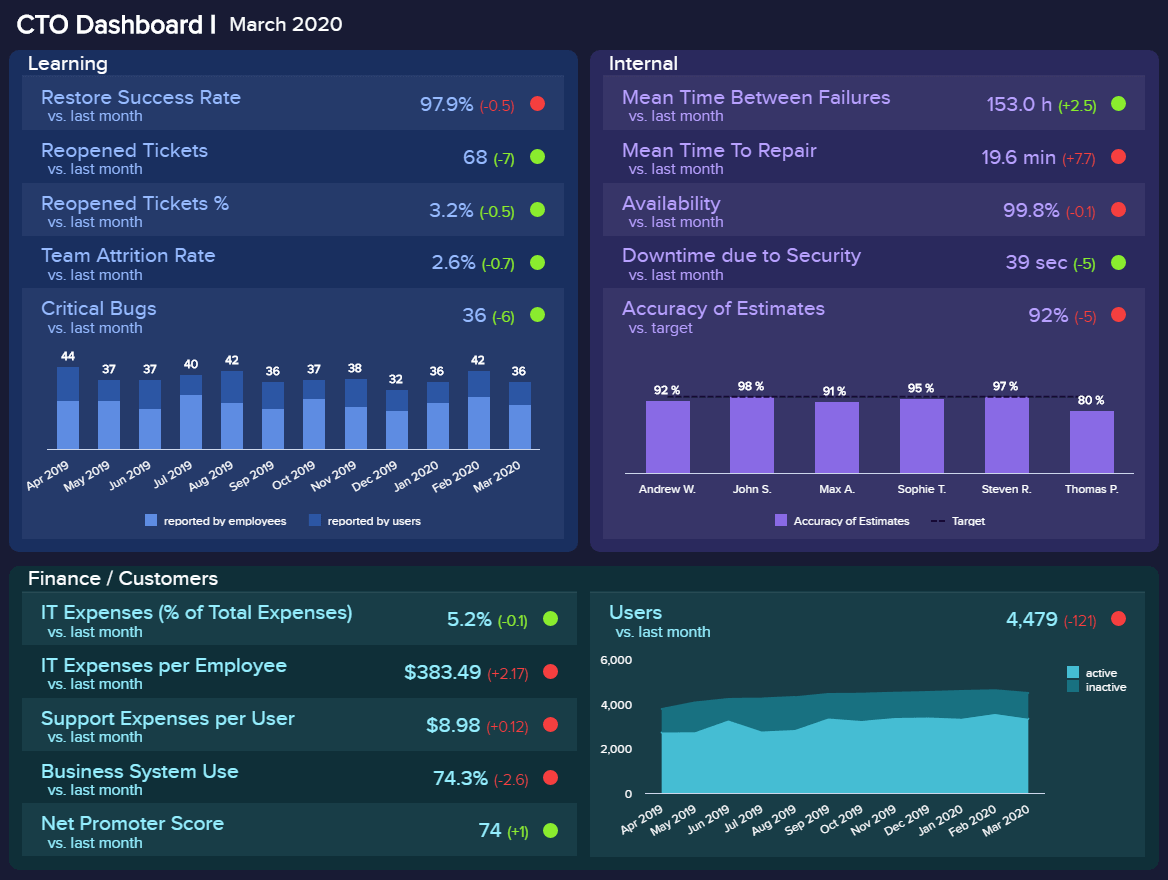
4. CTO Report Template
Finally, information technology reports for high-level executives have to include strategic planning and development in a longer time frame. CTOs have the task to manage multiple IT-related touchpoints and ensure that internal and external technological areas are aligned and have the potential to grow. That’s why creating a report is critical in order to manage and deliver that same growth. Here we will present an IT monthly report template specifically designed for C-level management.
**click to enlarge**
You can immediately spot 4 focal points that CTOs have on their radar: the learning, internal, finance/customers, and user metrics crucial for strategic progress. The learning part is developed with the ticketing system and bug issues in mind as well as the development over time and comparison with the previous month. Since the color-coding clearly shows whether there are issues or not (green indicating positive development while red that the metric needs attention), the CTO can assess the situation and dig deeper into the operational level of certain metrics.
On the right side, the internal area is delivering metrics on internal processes and how well the team manages the time between failures, to repair, availability, downtime, and accuracy of estimates. In this case, you can see that there are certain matters that need adjustments to keep the repairs and failures at a minimum.
The bottom of this monthly IT report template for management demonstrates the financial and customer-relevant metrics such as the percentage of IT expenses, per employee, support expenses, business system use, and net promoter score. These key performance indicators show the relationship between financial performance and whether customers are satisfied with the delivered service. If any of these metrics should change in a negative way, the CTO has to investigate why because it can directly affect the business. This dashboard can also be used as a CIO report template, the point is to adjust as needed and let the BI dashboard software do the hard work.
In the next part of the article, we will focus on best practices so you can start building reports on your own.
We offer a 14-day free trial. Benefit from great IT reports today!
Best Practices In IT Reporting
To avoid drowning in data and losing focus of what really matters, you need to ask yourself these questions before embarking on your IT reporting journey:
- Who are my IT reporting efforts aimed at?
- What kind of metrics matter to my audience?
- What is the strategy behind this report: typical daily management activities or a goal-oriented, strategic assessment of the current situation (assets, resources, etc.)?
Once you’ve taken the time to understand your core departmental goals, your general strategy, and considered your audience, you’ll be able to start creating your report. Here are the best practices to consider:
1. Select the right KPIs: When it comes to creating an effective IT management report, selecting the best key performance indicators for the job is essential. If you’ve taken ample time to consider your departmental goals, aims, and objectives as well as your audience, making the right choices should be relatively straightforward. A digital data dashboard that reports KPIs is interactive and visual, and by working with metrics that align with your goals, you’ll ensure you build your IT report sample on steady foundations.
2. Avoid duplication: When it comes to collecting important data, there is most likely a wide range of databases set up to gather information based on different aspects of your IT-based activities. A best practice is to keep everything as simple as possible and not duplicate data too much, even when an overlap seems inevitable. When the variation and volume of data increases, so does the complexity, the effort required and the general level of frustration.
3. Quality over quantity: Data quality is an essential part of reporting, particularly when it comes to IT. The outcomes of reporting are important and strategic decisions, and thus should not be based on false or failing information. Make data quality management an imperative matter of your reporting journey, and catch the data quality issues as early as possible.
4. Collaborate with the team: Collaborating with your team is essential. Working together on a report will bring out more than if only one brain was on it. Communicate your findings and see what they have analyzed and dug out from the analytics. With the help of self-service BI, it is easily feasible and several people can have access to the same source of knowledge and work.
5. Utilize templates: As you build your processes and collaborate with others, you can definitely utilize pre-built templates that will make the creation of your reports much easier and faster. There are solutions that offer many templates and you can easily pick one, adjust based on your parameters and metrics, and the dashboard is done. This will also help you become faster in your reporting process, especially if you automate and deliver the report each week or month. That brings us on to our next point.
6. Automate as much as possible: Last but certainly not least, automation is becoming increasingly important in our cutthroat environment. Especially when deadlines are in question, and projects need to be delivered on time, automating as much as possible becomes critical. In that case, having reports delivered on a special weekday or month, as we mentioned, fully automated with the established operational metrics or strategic ones, the whole organization can profit from it.
7. Share on multiple devices: Similar to our collaboration point, sharing through multiple devices is also critical since things can go wrong in seconds and if you’re not sitting at your desktop computer, the project or any IT-related task can go seriously wrong. That’s why having access to your reports on multiple devices such as mobile or tablet, can help to avoid issues and enable you to immediately answer any question that might arise.
“Everything is designed. Few things are designed well.”— Brian Reed
In the next part of the article, we will focus on real use-cases, where professionals can utilize the power of reporting IT metrics and data.
Real-life Applications Of Dashboards & IT Reporting
Following on from our practical IT reports examples, we’re going to explore some real-world use cases of modern dashboard reporting based on different organizational needs. While not all of these examples are directly related to IT, they serve to demonstrate the value of reporting tools designed to help businesses squeeze maximum value from their most precious technical data:
a) Management: Regardless of your industry or sector, if you’re a senior member of staff, you’ll be required to communicate with other managers and executives on top-level business initiatives. That said, if you’ve identified recurrent IT issues that need fixing or are looking to develop new technical initiatives to roll out across the organization, you’ll need to clearly communicate these objectives in cross-departmental meetings. A technical support report template will help you do just that—as will adhere to management reporting best practices.
b) SaaS: If your business offers, develops, or works with software-as-a-service platforms, a dynamic SaaS dashboard (akin to IT reporting tools) will help you maximize the impact of your most valuable data, some of which can be used to enhance your technical support initiatives. SaaS businesses have the goal to establish their IT solutions on the market, increase their customers’ base and loyalty, and generate profits. To be able to do so, comprehensive reporting is needed, and dashboards can help.
c) TV dashboards: By taking your technical support report template data and displaying it as a TV dashboard, you’ll be able to give everyone within the department real-time access to important information. Moreover, with TV dashboards strategically positioned throughout the organization, you’ll be able to improve transparency and give everyone within the business the information they need to do their job better.

“Big data is at the foundation of all of the megatrends that are happening today, from social to mobile to the cloud to gaming.” – Chris Lynch
The 3 applications mentioned above are merely the tip of the iceberg when you’re talking about the power and versatility of dynamic digital data reports.
We offer a 14-day free trial. Benefit from great IT reports today!
Whether you’re working with an IT department monthly report sample, a weekly sample, or any other level of report, you will boost your business performance to no end. Your IT department is the lynchpin of almost any organization. Improve the efficiency, intelligence, and responsiveness of your information technology performance, and the rest will follow.
It’s clear that to run your IT department to its optimum capacity, you need access to tools and information that far surpass basic metrics and insights alone. Interactive modern data reports are the way forward. Mobile, agile, robust, customizable, and highly-visual, modern technical reports will help you tackle issues with ease, improve the departmental structure, and make all-important daily, weekly, and monthly decisions with a justified sense of confidence.
Delivering valuable and uncompromised IT support to your end-users will determine the success and ongoing performance of your entire IT ecosystem. To manage every aspect with efficiency, you must work with the right tools and follow the best practices. By understanding what you need to do to create effective reports and drilling down into the wealth of features that such tools offer, you will make your IT department unstoppable, accelerating the success of the entire business in the process.
Do you want to hop aboard the analytics and reporting train? Try our 14-day free trial and level up your IT department today.
The post Accelerate Your Business Performance With Modern IT Reports appeared first on BI Blog | Data Visualization & Analytics Blog | datapine.