Clik here to view.

To answer the question, “how can I get the answers I need to solve the new business challenges I face every day?”, there are two answers that go hand in hand: good exploitation of your analytics, that come from the results of a market research report. Market research analyses are the go-to solution for many professionals, and with reason: they save time, they provide new insights and clarification on the business market you are working on and help you to refine and polish your strategy. Besides, they also add more credibility to your work and add weight to any marketing recommendations you would give to a client or executive.
However, today’s business world still lacks a way to present market-based research results in an efficient manner – the static, antiquated nature of PowerPoint makes it a bad choice in the matter, yet it is still widely used to present results. Today, there are online data visualization tools that make it easy and fast to build powerful market-centric research dashboards. They come in handy to manage the results, but also the most important aspect of any analysis: the presentation of said results, without which it becomes hard to make accurate, sound decisions.
Here, we consider the benefits of conducting research analyses while looking at how to write and present market research reports and, ultimately, get the very most from your research results by using professional market research software.
Let’s get started.
What Is A Market Research Report?
An effective modern means of extracting real value from your research results such as brand analysis, market research reports present and arrange data in a way that is digestible and logical in equal measures through professional online reporting software and tools.
On a typical market research results example, you can interact with valuable trends, gain an insight into consumer behavior, and visualizations that will empower you to conduct effective competitor analysis. Rather than adding streams of tenuous data to a static spreadsheet, a full market research report brings the results of market-driven research to life, giving users a data analysis tool to create actionable strategies from a range of consumer-driven insights.
With digital market analysis reports, you can make your business more intelligent, more efficient, and, ultimately, meet the needs of your target audience head-on, This, in turn, will accelerate your commercial success significantly.
How To Present Your Results: 3 Market Research Example Dashboards
When it comes to sharing the most important information, research dashboards are invaluable.
Any market analysis report example worth its salt will allow everyone to get a firm grip on their results and discoveries on a single page, with ease. These dynamic online dashboards also boast interactive features that empower the user to drill down deep into specific pockets of data while changing demographic parameters, including gender, age, and region, filtering the results swiftly to focus on the most relevant information for the task at hand.
These 3 market research reports examples are different but equally essential and cover key elements required for market survey report success. You can also modify each, and use it as a client dashboard.
While there are numerous types of dashboards that you can choose from to adjust and optimize your results, we have selected the top 3 that will tell you more about the story behind them. Let’s take a closer look.
1. Market Research Report: Brand Analysis
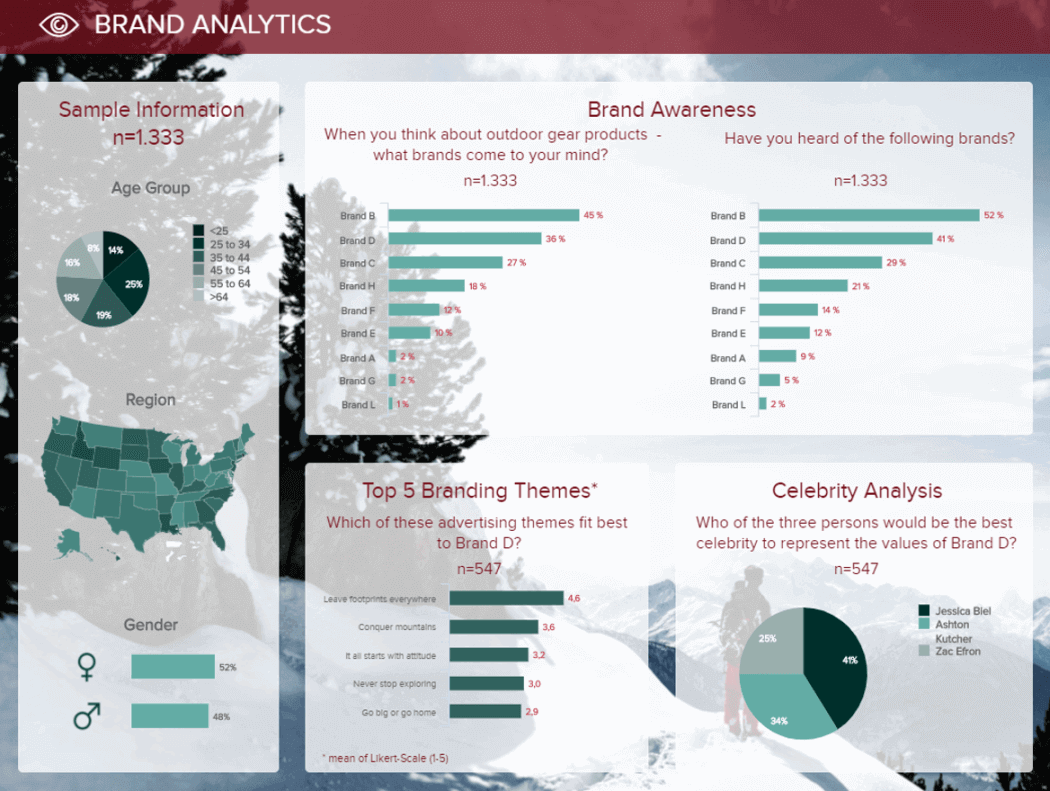
Our first example shares the results of a brand analysis study. To do so, a survey has been performed on a sample of 1333 people, information that we can see in detail on the left side of the board, summarizing the gender, age groups, and geolocation.
**click to enlarge**
On the center on the dashboard, we can see the market-driven research results concerning first the brand awareness with and without help, as well as themes and celebrity suggestion, to know which image the audience associates with the brand.
Such dashboards are extremely convenient to share the most important information in a snapshot. Besides, being interactive (but it cannot be seen on an image), it is even easier to filter the results according to certain criteria without needing to produce dozens of PowerPoint slides. For instance, I could easily filter the data by choosing only the female answers, or only the people aged between 25 and 34, or only the 25-34 males if that is my target audience.
Primary KPIs:
a) Unaided Brand Awareness
The first market research KPI in this most powerful report example comes in the form of unaided brand awareness. Presented in a logical line-style chart, this particular market research report sample KPI is invaluable, as it will give you a clearcut insight into how people affiliate your brand within their niche.
Clik here to view.
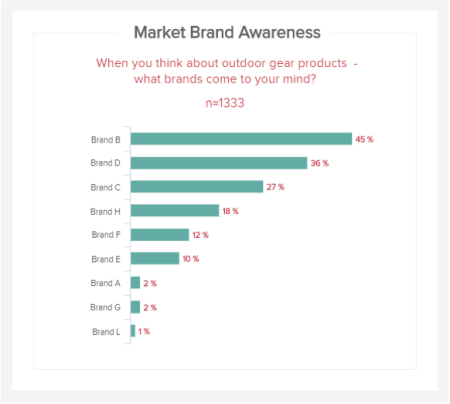
As you can see from our example, based on a specific survey question, you can see how your brand stacks up against your competitors in terms of awareness. Based on these results, you can formulate strategies to help you stand out more in your sector and, ultimately, expand your audience.
b) Aided Brand Awareness
This market survey report sample KPI focuses on aided brand awareness. A visualization that offers a great deal of insight into which brands come to mind in certain niches or categories, here, you will find out which campaigns and messaging your target consumers are paying attention to and engaging with.
Clik here to view.

By gaining access to this level of insight, you can conduct effective competitor research and gain valuable inspiration for your products, promotional campaigns, and marketing messaging.
c) Brand image
Clik here to view.
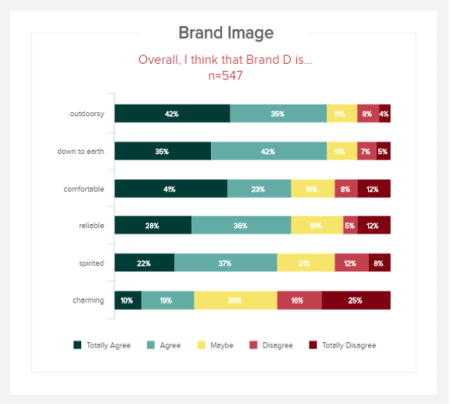
When it comes to research reporting, understanding how others perceive your brand is one of the most golden pieces of information you could acquire. If you know how people feel about your brand image, you can make informed and very specific actions that will enhance the way people view and interact with your business.
By asking a focused question, this most visual of KPIs will give you a definitive idea of whether respondents agree, disagree, or are undecided on particular descriptions or perceptions related to your brand image. If you’re looking to present yourself and your messaging in a certain way (reliable, charming, spirited, etc.), you can see how you stack up against the competition and find out if you need to tweak your imagery or tone of voice – invaluable information for any modern business.
2. Market Research Results On Customer Satisfaction
Here we have some of the most important data a brand should care about: their already-existing customers and their perception of the relationship they have with the brand. It is crucial when we know that it is 5 times more expensive to acquire a new customer than to retain one.
Clik here to view.
**click to enlarge**
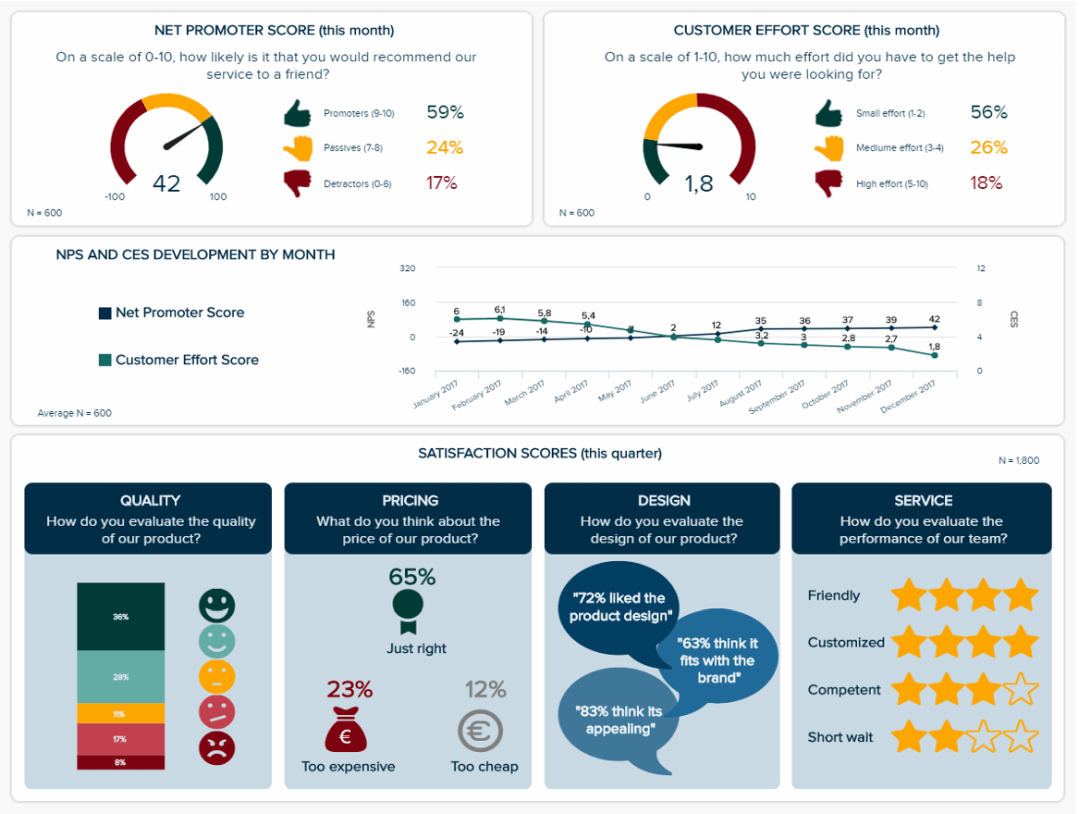
This is why tracking metrics like the customer effort score or the net promoter score (how likely are consumers to recommend your products and services) is essential, especially over time. You need to improve these scores to have happy customers who will always have a much bigger impact on their friends and relatives than any of your amazing ad campaigns. Looking at other satisfaction indicators like the quality, the pricing, and design, or the service they received is also a best practice: you want a global view of your performance when it comes to customer satisfaction metrics.
Such research results reports are a great tool for managers who do not have much time, and hence need to use it effectively. Thanks to these dashboards, they can control data for long-running projects at any time.
Primary KPIs:
a) Net Promoter Score (NPS)
Another pivotal part of any informative market research presentation, your NPS Score will tell you how likely a customer is to recommend your brand to their peers.
Clik here to view.
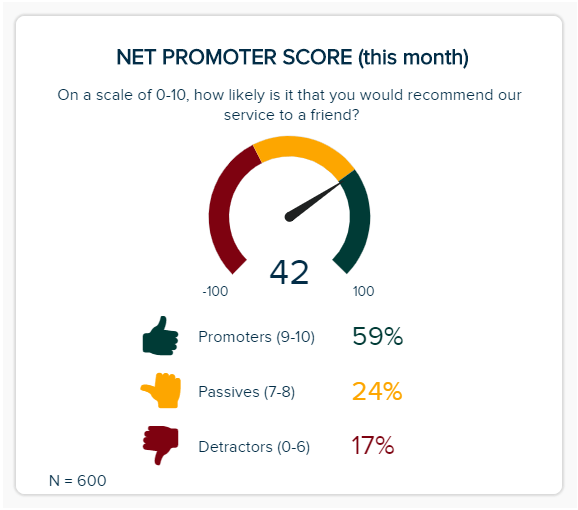
Centered on overall customer satisfaction, your NPS Score can cover the functions and output of many departments, including marketing, sales, customer service but also serve as a building block for a call center dashboard. When you’re considering how to present market research effectively, this balanced KPI offers a masterclass. It’s logical, it has a cohesive color scheme, and it offers access to vital information at a swift glance. With an NPS Score, customers are split into three categories: promoters (those scoring your service 9 or 10), passives (those scoring your service 7 or 8), and detractors (those scoring your service 0 to 6). The aim of the game is to gain more promoters. By gaining an accurate snapshot of your NPS Score, you can create intelligent strategies that will boost your results over time.
b) Customer Satisfaction Score (CSAT)
The next in our examples of market research reports KPIs comes in the form of the CSAT. The vast majority of consumers that have a bad brand experience will not return. Honing in on your CSAT is essential if you want to keep your audience happy and encourage long-term brand loyalty.
Clik here to view.
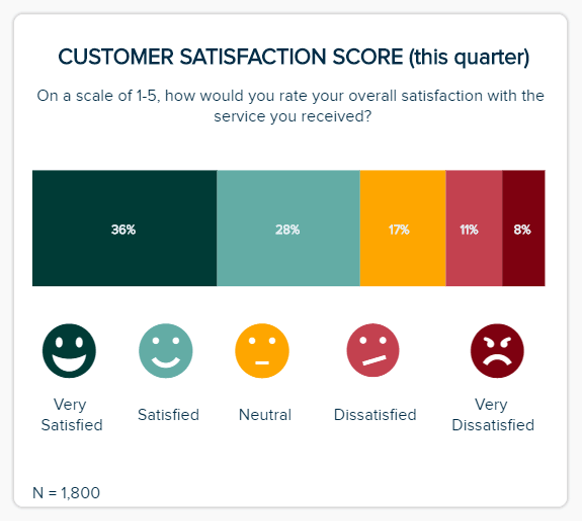
This magnificent, full market research report KPI will show you how satisfied customers are with specific elements of your products or service. Getting to grips with these scores will allow you to pinpoint very specific issues while capitalizing on your existing strengths. As a result, you will be able to take measures to improve your CSAT score while sharing positive testimonials on your social media platforms and website to build trust.
c) Customer Effort Score (CES)
When it comes to presenting market research findings, keeping track of your CES Score is essential. The CES Score KPI will give you instant access to information on how easy or difficult your audience finds it to interact or discover your brand based on a simple scale of one to ten.
Clik here to view.
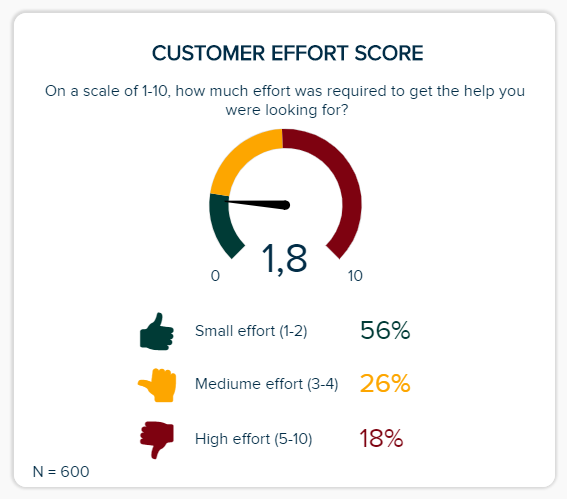
By getting a clear-cut gauge of how your customers find engagement with your brand, you can iron out any weaknesses in your user experience (UX) offerings while spotting any friction, bottlenecks, or misleading messaging. In doing so, you can boost your CES score, satisfy your audience, and boost your bottom line.
3. Market Research Results On Product Innovation
This final market-driven research example of report focuses on the product itself, and its innovation. It is a useful report for future product development and market potential, as well as pricing decisions.
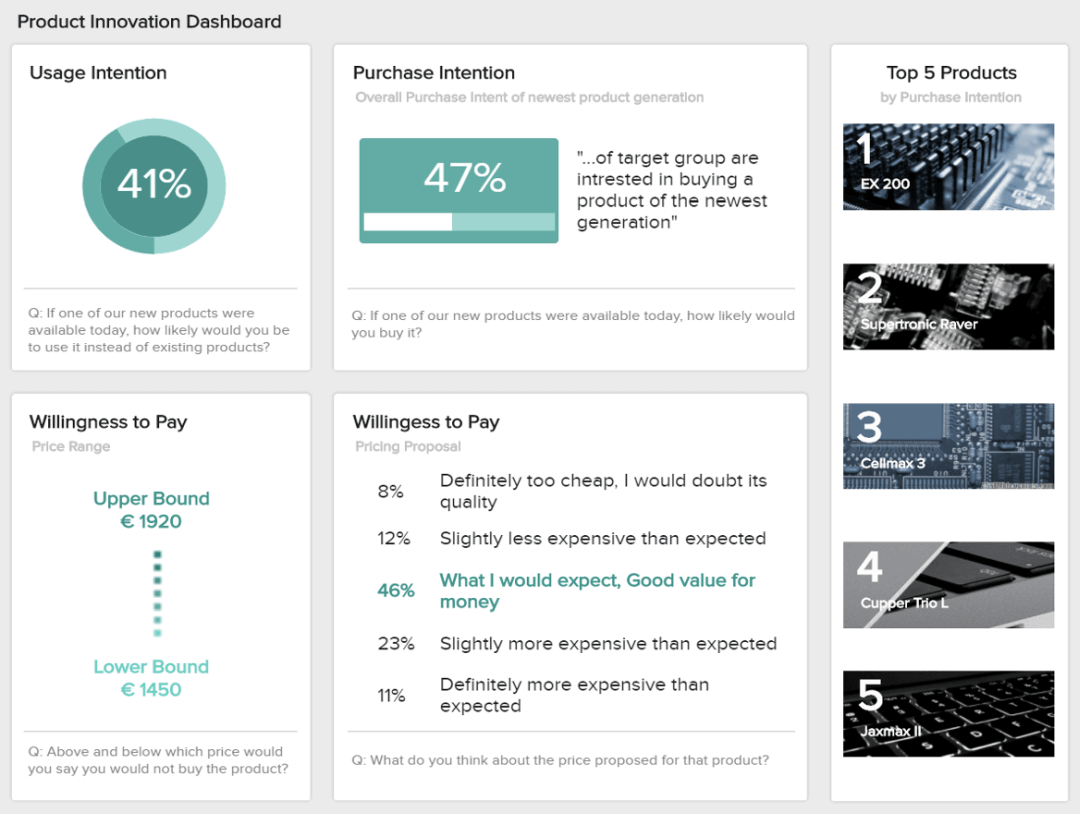
**click to enlarge**
Using the same sample of surveyed people as for the first market-focused analytical report, they answer questions about their potential usage and purchase of the said product. It is good primary feedback on how the market would receive the new product you would launch. Then comes the willingness to pay, which helps in setting a price range that will not be too cheap to be trusted, nor too expensive for what it is. That will be the main information for your pricing strategy.
Primary KPIs:
a) Usage Intention
The first of our product innovation KPI-based market research examples comes in the form of usage intention. When you’re considering how to write a market research report, including metrics centered on consumer intent is critical.
Clik here to view.
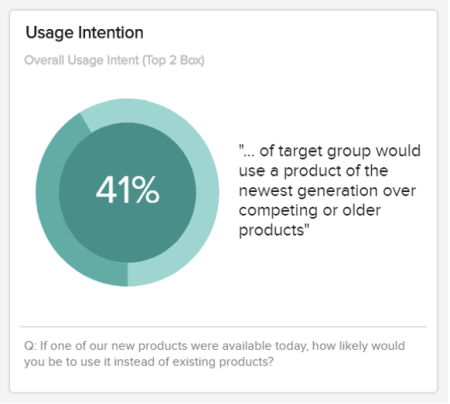
This simple yet effective visualization will allow you to understand not only how users see your product but also whether they prefer previous models or competitor versions. While you shouldn’t base all of your product-based research on this KPI, it is very valuable, and you should use it to your advantage frequently.
b) Purchase Intention
Another aspect to consider when looking at how to present market research data is your audience’s willingness or motivation to purchase your product. Offering percentage-based information, this effective KPI provides a wealth of at-a-glance information that will help you make accurate forecasts centered on your product and service offerings.
Clik here to view.
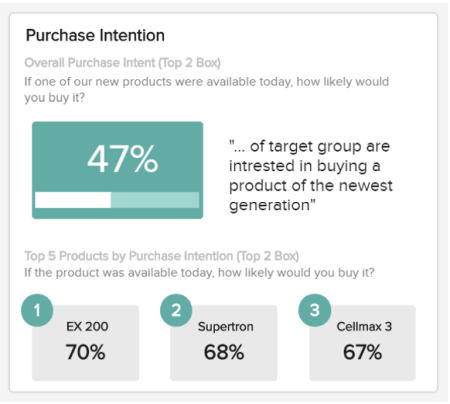
Analyzing this information regularly will give you the confidence and direction to develop strategies that will steer you to a more prosperous future, meeting the ever-changing needs of your audience on an ongoing basis.
c) Willingness To Pay (WPS)
Clik here to view.
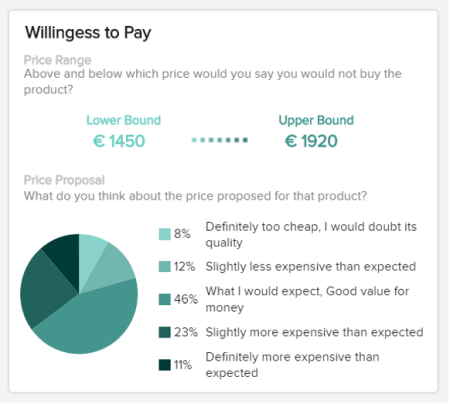
Our final market research analysis example KPI is based on how willing customers are to pay for a particular service or product based on a specific set of parameters. This dynamic visualization, represented in an easy-to-follow pie chart, will allow you to realign the value of your product (USPs, functions, etc.) while setting price points that are most likely to result in conversions. This is a market research presentation template that every modern business should use to their advantage.
Why You Need These Kinds Of Reports?
As the adage goes, “look before you leap“ – and that is exactly what a research report is here for. As the headlights of a car, they will show you the pitfalls and fast lanes on your road to success: likes and dislikes of a specific market segment in a certain geographical area, their expectations, and readiness. Among other things, a research report will let you:
- Get a holistic view of the market: learn more about the target market and understand the various factors involved in the buying decisions. Getting a broader view of the market lets you benchmark other companies you do not focus on.
- Validate internal research: doing the internal analysis is one thing, but double-checking with a third-party also greatly helps in not getting blinded by your own data.
- Use actionable data and make informed decisions: once you understand consumer behavior as well as the market, your competitors, and the issues that will affect the industry in the future, you are better armed to position your brand. Combining all of it with the quantitative data collected will allow you for more successful product development. To learn more about different methods, we suggest you read our guide on data analysis techniques.
- Strategic planning: when you want to map out big-picture organizational goals, launch a new product development, plan a geographic market expansion, or even a merger and acquisition – all of this strategic thinking needs solid foundations to fulfill the variety of challenges that come along.
How To Present Market Research Results?
Clik here to view.

Here we look at how you should present your research reports, considering the steps it takes to connect with the outcomes you need to succeed:
- Hone in on your research:
When looking at how to source consumer research in a presentation, you should focus on two areas: primary and secondary research. Primary research comes from your internal data, monitoring existing business practices, the effectiveness of sales, and the tools used for communication, for instance. Primary research also assesses market competition by evaluating the business plans of the competitors. Secondary research focuses on existing data collected by a third party, information used to perform benchmarking, and market analysis. Such metrics help in deciding which market segments are the ones the company should focus its efforts on or where the brand is standing in the minds of consumers. Before you start the reporting process, you should set your goals, segmenting your research into primary and secondary segments to get to grips with the kind of information you need to work with to achieve effective results.
- Set your KPIs:
To start with, keep in mind that your reports should be concise and accurate – straight to the point without omitting any essential information. Work to ensure that your data is clean and organized, with participants grouped into relevant categories (demographics, profession, industry, education, etc.). Once you’ve organized your research, set your goals, and cleaned your data, you should set your KPIs to ensure your report is populated with the right visualizations to get the job done. Explore our full library of interactive KPI examples for inspiration.
- Produce your summary:
To complement your previous efforts, writing an executive summary of one or two pages that will explain the general idea of the report is advisable. Then come the usual body parts:
- An introduction providing background information, target audience, and objectives;
- The qualitative research describing the participants in the research and why they are relevant for the business;
- The survey research outlining the questions asked and answered;
- A summary of the data used to draw the conclusions, the research methods chosen, and why;
- A presentation of the findings based on the research you conducted and an in-depth explanation of these conclusions.
- Use professional data dashboards:
To optimize your market research-centric data and discoveries, you must work with a dynamic business dashboard. Not only are modern dashboards presentable and customizable, but they will offer you past, predictive, and real-time insights that are accurate, interactive, and yield long-lasting results.
Bringing Your Reports a Step Further
Even if still wide-spread for market-style research results presentation, the use of PowerPoint at this stage is a hassle and presents many downsides and complications. When always-busy managers or short-on-time top executives grab a report, they want a quick overview that provides them with an idea of the results, the big-picture that addresses the objectives: they need a dashboard.
We all know that a picture conveys more information than simple text or figures, so managing to bring it all together on an actionable dashboard will convey your message more efficiently. Besides, market research dashboards have the incredible advantage to always be up-to-date, since they work with real-time data: the synchronization/updating nightmare of dozens of PowerPoint slides doesn’t exist for you anymore. This is particularly helpful for tracking studies performed over time, that recurrently need their data to be updated with more recent ones.
In today’s fast-paced business environment, companies have to identify and grab new opportunities as they arise, while staying away from threats and adapt quickly. In order to always be a step further and make the right decisions, it is critical to perform market research studies to get the information needed and make important decisions with confidence.
A visual market research report is the best way to understand your customer and thus increase their satisfaction by answering their needs and expectations. It also helps you see what the factors influencing your business are, where your brand is situated, and get the temperature of the market before a product launch. Once all the analysis and studies are done, it is time to present them efficiently, so as to onboard everyone and make the right decisions for your business strategy: market research reports are your key allies in the matter.
To start presenting your results with efficient dynamic research reports, you can try our dashboard reporting software and test it thanks to our 14-day free trial!
The post How To Present Your Market Research Results And Reports In An Efficient Way appeared first on BI Blog | Data Visualization & Analytics Blog | datapine.