 “The goal is to turn data into information, and information into insight.” – Carly Fiorina, former executive, president, HP
Digital data is all around us. In fact, we create around 2.5 quintillion bytes of data every single day, with 90% of the world’s digital insights generated in the last two years alone, according to Forbes.
If utilized correctly, data offers a wealth of opportunity to individuals and companies looking to improve their business’ intelligence, operational efficiency, profitability, and growth over time. In this day and age, a failure to leverage digital data to your advantage could prove disastrous to your business – it’s akin to walking down a busy street wearing a blindfold.
With the rate of available data growing exponentially, it’s crucial to work with the right online reporting tools to not only segment, curate, and analyze large data sets but also uncover answers to new questions that you didn’t even know existed. And when it comes to finding actionable answers to specific questions, ad hoc analysis and reporting are essential. We will explain the ad hoc reporting meaning, benefits, uses in the real world, but first, let’s start with the ad hoc reporting definition.
Try our professional reporting software for 14 days, completely free!
What Is Ad Hoc Reporting?

**click to enlarge**
Ad hoc reporting, also known as one-time ad hoc reports, helps its users to answer critical business questions immediately by creating an autonomous report, without the need to wait for standard analysis with the help of real-time data and dynamic dashboards.
Working alongside recurring or ongoing (daily, weekly, or monthly) data reports, ad hoc reporting forms a vital part of any business, brand, or organization’s growth and sustainability by offering a level of insight that adds an extra layer of substance and success to the data driven decision making process.
While these reports are typically developed using SQL (structured query language) by an IT department which can take several days, there are tools and platforms that allow non-technical business users access to these most precious insights, simply using a SQL report generator. And this lies in the essence of the ad hoc reporting definition; providing quick reports for single-use, without generating complicated SQL queries.
Moreover, a host of ad hoc analysis or reporting platforms boast integrated online data visualization tools to help enhance the data exploration process. This reduces the reliance on software developers or IT personnel for simple analysis and reporting.
After explaining the ad hoc reports meaning, we will now take a closer look at the analysis part in more detail.
What Is Ad Hoc Analysis?
Ad hoc analysis is a business intelligence (BI) procedure that serves to provide answers to specific, standalone business challenges or questions using available data from various sources and it’s created on the spot, as needed, without involving the IT department.
With ad hoc analysis, users often create a report that does not currently exist or drill deeper into an existing dashboard report to achieve a deeper level of insight that ultimately benefits the ongoing success and sustainability of the organization.
Ad hoc data analysis is the discoveries and subsequent action a user takes as a result of exploring, examining, and drawing tangible conclusions from an ad hoc report.
Typically, ad hoc data analysis involves discovering, presenting, and actioning information for a smaller, more niche audience and is slightly more visual than a standard static report. Now that you know the ad hoc analysis meaning, it is time to look into the benefits, and afterward, real-world and practical examples.
“Without big data, you are blind and deaf and in the middle of a freeway.” – Geoffrey Moore
The Benefits Of Ad Hoc Reporting And Analysis
Now that we’ve asked the question, ‘what is an ad hoc report?,’ explained the ad hoc reporting meaning, let’s look at the clear-cut benefits of using these types of data reports:
1. Reduces the IT workload:
The self-service nature of ad hoc reporting catalyzes the report creation process by allowing end-users to work with customized reports on niche areas of the business without relying on the technical assistance of developers. This saves time and costs while minimizing any potential interdepartmental roadblocks.
2. Easy to use:
As ad hoc data analysis platforms or dashboards are intuitive and visual by nature, uncovering the right answers to the right questions is simpler than ever before, allowing users to make decisions and roll out initiatives that help improve their business without the need for wading through daunted streams of data.
3. Ensures flexibility within the constantly changing business environment:
Ad hoc data analysis offers an interactive reporting experience, empowering end-users to make modifications or additions in real-time. As report elements are picked individually, users can ask questions and make customizations that suit their needs and goals. It is of utmost importance to answer business questions as quickly as possible, and one of the benefits of ad hoc reporting provides just that – the possibility to follow the ever-changing business environment, as the business moment requires and continually evolves.
4. Saves time and costs:
Modern ad hoc reporting tools are designed to save countless hours since their interface is designed to be simple, yet powerful. The intuitive nature helps users to create interactive visuals without the need to wait for a professional analyst or, as mentioned, the IT department. This self-service BI nature that enables a data-driven system completely in control by the user, ultimately, saves countless working hours and costs since users don’t have to wait for reports and build as many types of ad hoc reports as needed.
Moreover, the team will be more engaged if they can immediately manipulate formulas and avoid multiple spreadsheets to consolidate data or static presentations that are fixed upfront and give no possibility to dig deeper into the data.
5. Completely customizable:
While ad hoc enterprise reporting is focused on gaining and keeping visibility across a large organization, it’s important to consider the customization possibilities that these reports have on offer. Some of the tools offer built-in dashboards, for example, that already have templates that you can use and adjust based on your needs. That way, you can save even more time and focus on what truly matters: the business answer you were looking for. But not only, as the possibility to build your own queries within the advanced SQL box, as mentioned, will provide you with even more freedom if you’re an experienced analyst and look for modern software solutions.
Try our professional reporting software for 14 days, completely free!
Ad Hoc Analysis Examples – The Real World
There’s no doubt about it: ad hoc data analysis offers a wealth of value to businesses across industries and sectors. To demonstrate the potential of ad hoc analysis, let’s delve deeper into the practical applications of this invaluable data-driven initiative in the business world.
-
Ad hoc financial analysis:
An additional ad hoc reporting example can be focused on finance. By its very nature, the financial industry (or the financial departments) is rife with facts, figures, financial KPIs, metrics, and data. Ad hoc data analysis has offered businesses the means to drill down deep into very concentrated segments of data – or business aims – gaining the ability to spot trends that will provide the best return on investment (ROI).
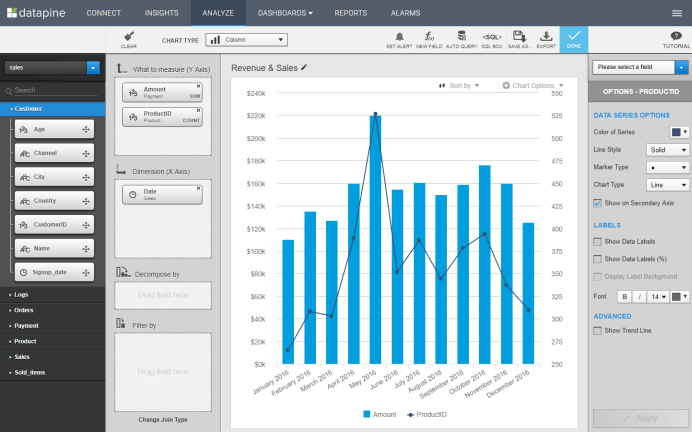
In essence, you build ad hoc financial reports whenever you need to gain a deeper understanding of your financial data. For example, at the end of the month, you need to find out how much revenue you have left after deducting your direct costs. Essentially, you (or a stakeholder) want to know your gross profit margin asap.

What is ad hoc reporting bringing here is an immediate answer, without the need to wait for days from the IT department to generate a simple visual like the one above, or complete ad hoc dashboards if you have a specific meeting or presentation planned.
While these are the primary industries that benefit from ad hoc data analysis, regardless of your sector, by utilizing reports like this alongside interactive business intelligence dashboards, you will see notable improvements in key areas of your business.
-
Ad hoc reports in sales:
Ad hoc reporting and analysis can be used in a company with a large sales database. Let’s say a user wants to find out the outcome of a specific sale related to a particular scenario, s/he would build a single report, used only once, to provide that result. This scenario can be found in companies that have a large outside-sales force which then can export an ad hoc report showing results from his/her territory (number of clients visited, or leads generated) against overall sales goals.
-
Ad hoc reporting in healthcare:
Another ad hoc reporting example we can focus on is healthcare. A physician may not know how to build an HTML report or run a SQL query, but a reporting tool can easily generate data that are needed quickly, and only once – a blood test report, for example, or how many people were admitted to the ER on a specific day/week.
Ad hoc analysis has served to revolutionize the healthcare sector. Utilizing a healthcare analytics software by providing greater data visibility and improving accuracy while helping senior stakeholders in such institutions make swift and accurate decisions that ultimately save lives, improves operational efficiencies, and decrease mortality rates.
-
Government:
Governmental entities deal with a wealth of critical information, insights, and decisions that ultimately affect a lot of people. By gaining the ability to hone in on very specific tasks or challenges and reach the level of insight needed to make accurate, prosperous decisions while automating once manual data gathering tasks, governmental bodies across the globe enjoy improved public fund allocation while boosting productivity. A testament to the power of ad hoc analysis.
-
Ad hoc recruiting reports:
Running personalized, quick, and accurate recruiting reports is of utmost importance in our competitive business environment. Using an ad hoc reports example from HR, companies have the chance to spot deficiencies within their human resources management and improve employee satisfaction levels, which is critical considering the lack of talents across industries.
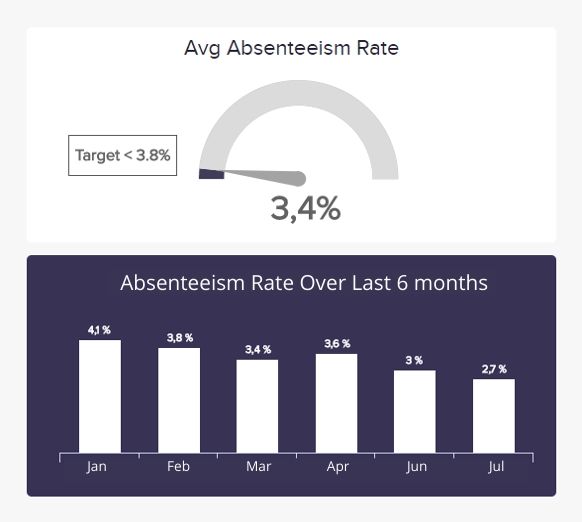
In a practical sense, you could suspect or assume a higher absenteeism rate over the course of a year or 6 months. Investigating further by generating an ad hoc reports example similar to the one above could prove to be extremely advantageous. The company can identify if the assumption was correct, meaning if rates went higher, are stable, or decreasing. In case there is an increment, you can easily determine the cause by engaging with employees and find an appropriate solution to your problem. To create such visuals, you can explore our article on the most prominent recruitment metrics.
-
Retail:
Ad hoc data analysis proves particularly effective in loss prevention in the retail sector. Through store-specific retail analytics report, tailored to particular areas of loss prevention, such as shoplifting or employee theft, a host of notable retailers have been able to track inventories and spot trends that have saved them a great deal of money (and time) in the long run.
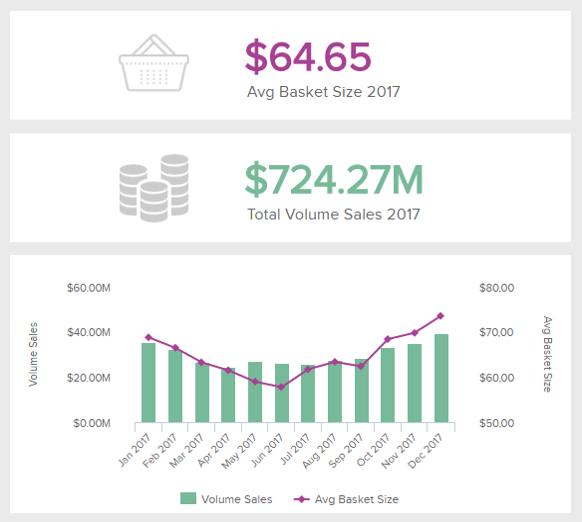
In retail, it’s important to regularly track the sales volumes in order to optimize the overall performance of the online shop or physical stores. An ad hoc report example such as the one above could pinpoint specific weeks where the sales volume was lower than usual. By examining the report deeper, you can conclude that the demand was lower due to external conditions, for example, such as a heavy storm that postponed deliveries and caused many cancellations.
-
Education:
The educational sector is vital to the future of our society, and ad hoc data analysis has played a significant role by streamlining a host of processes through focused data and analytical reporting. It also facilitates the sharing of information between departments to help engage students on a deeper, more personal level. This level of initiative results in improved success for faculty, students, and in turn – the economy.
What are ad hoc reports bringing to the table is simple: efficient decentralization of data management and transferring the analytical processes directly to the end-user. While there are numerous data analysis methods you can utilize, an ad hoc reporting system will enable you to perform analyses on the spot and immediately answer the question you have asked. This is not only critical in business intelligence but, as we have seen, in other areas such as education or government services.
Since we expounded on the ad hoc report definition, provided examples, and examined the most prominent benefits, now we will focus on what to look for in such tools in order to generate maximum business value.
Try our professional reporting software for 14 days, completely free!
What To Look For In Ad Hoc Reporting Tools?

To create the best possible reports, there are some features that these solutions should have on offer in order to ensure maximum application value. Here we list the most critical ones:
1. Advanced interactivity features
It’s fairly easy to generate a spreadsheet but if that spreadsheet doesn’t give you an answer you’re looking for, then you will have thousands of rows and columns that will cannot easily manipulate with. Interactive ad hoc reports will enable you to drill into bits and pieces of specified data analysis and ensure you can interact with your report by using advanced interactive features of professional business intelligence dashboard software.
From advanced chart options and sophisticated filters to time intervals and chart zooms; the possibilities to interact with your data are immense. Besides, overcrowding your screen space is a thing of the past – interactivity features of the modern dashboard software continue to evolve and adjust to the users.
2. Access to numerous data sources
By having access to different data sources in one single place, a report can easily answer current and upcoming business questions with every piece of data a company has.
With solid ad hoc reporting software, it’s possible to apply controls to specific dashboards by adding elements like screen filters, sliders, conditional formatting for filtering, and link reporting dashboards for direct comparison. That way all data can be easily accessed and managed.
3. Basic and advanced analytical possibilities
Ad hoc reporting solutions need to offer basic and advanced analytical capabilities. No matter if you’re an average business user that needs to extract a simple report or advanced analyst that creates custom queries, ad hoc analyses should cover both. That way, the business user has a chance to utilize a drag-and-drop interface where you simply need to drag the values to be able to analyze them, and the analyst has a special SQL box where s/he can build queries on their own.
4. Data visualization capabilities
It’s a scientific fact that humans are visual learners since half of the human brain is devoted to processing visual information. Data visualization helps in understanding larger or smaller volumes of data much faster than a written or spoken word. In other words, charts are much powerful than pure numbers, columns, or rows of raw data. For example, a sales graph will immediately show you the main developments in your sales processes in comparison to simply presenting a spreadsheet filled with numbers or PowerPoint presentation clogged with bullet points and sentences.
5. Artificial intelligence features
Operational ad hoc reporting oftentimes includes also questions about the future. Professional software has built-in predictive analytics features that are simple, yet extremely powerful. For a practical ad hoc analysis example, let’s say a stakeholder wants to know what kind of revenue they can expect in the next 6 months based on the specified marketing channels. Based on selected past data points, the tool will automatically calculate predictions and you have your ad hoc answer within minutes. Keep in mind that although these features are extremely advanced, no one can predict the future with 100% accuracy. The point is to gain a data overview in order to better prepare for potential business changes.
6. Numerous sharing options
One of the goals of business intelligence and ad hoc reporting is to simplify the decision-making processes while enabling a collaborative culture between colleagues and departments. The creation of reports is fairly easy but the sharing process should be as well. Professional business reporting software will cover multiple sharing options:
- sharing through e-mails immediately or with a specified time interval
- viewer area that enables external parties to manipulate the dashboard based on filters you have assigned
- public URL will enable you to send a simple link
- an embedded dashboard that you can insert within an application or website, e.g.
“He who would search for pearls must dive below.” – John Dryden
Ad Hoc Reporting Tool Example
It’s clear that ad hoc reporting offers a host of benefits to the ongoing success and growth of any ambitious modern business. And when it comes to an ad hoc reporting software that offers freedom, flexibility, and usability while helping answer critical questions both swiftly and accurately, datapine’s data visualization and reporting tool ticks all the boxes.
Aimed specifically at the end-user, our different types of dashboards and self-service reporting tools are intuitive and accessible, which means you don’t have to possess a wealth of technical knowledge to utilize our platforms. The drag-and-drop interfaces make handling important data sets both logical and digestible. Moreover, our cutting-edge algorithms run in the background of our applications to fortify our interface with enhanced built-in intelligence to help you during every step of your ad hoc data analysis journey.
For reporting on the go, our tools, applications, and dashboards also allow you to monitor data and generate fresh insights any time, anywhere with your web browser or tablet, safe in the knowledge that your data privacy and security are being preserved to the highest standards.
At datapine, we’ve invested an incredible level of time and effort in developing an enterprise-level security layer akin to core banking applications. As a result, it’s possible to copy existing data into our data warehouse to speed up your workload or retain your data in-house by connecting datapine to your server remotely. And as you’re free from the shackles of managing your data from one specific location, sharing your dashboards, KPI reports, discoveries, and insights with colleagues are possible with just a few clicks.
To discover more about our tools, solutions, and services, explore our business intelligence features page.
Try our professional reporting software for 14 days, completely free!
If you want to delve deeper into the power of superior data analysis, then our completely free 14-day trial will help you to start your journey towards data-driven enlightenment!
The post What Is Ad Hoc Reporting? Your Guide To Definition, Meaning, Examples & Benefits appeared first on BI Blog | Data Visualization & Analytics Blog | datapine.