 “The only safe ship in a storm is leadership.” – Faye Wattleton
For any business to succeed, it needs purpose, direction, and the resources to grow as well as adapt to the landscape surrounding it – which is why strong leadership is essential.
As a CEO, you’re responsible for overseeing every aspect of your business, from the people and the internal culture all the way through to key sales, marketing, and financial strategies. While your organization is no doubt brimming with the kind of talent that can drive every aspect of your organization forward, ultimately, the success of the company rests on your shoulders.
Compassion and people skills aside, every strong business leader needs the vision to be the best they can be. And to gain greater vision, you need to embrace the power of digital data with the help of professional CEO dashboards and reports.
Try our professional dashboard software for 14 days, completely free!
By leveraging smart online data analysis in the right way, you will gain access to insights that will help you develop strategies that foster growth and innovation while keeping your staff motivated, engaged, and happy. In this age, making rough estimates or shooting in the dark will only get you so far. For this reason, gaining access to the perfect mix of tangible insights is vital.
But how can you achieve this?
As mentioned, CEO dashboards and CEO reports are the answer. By leveraging the power of an online dashboard, an executive story can be written effortlessly, and within minutes. Here, we’ll consider what a leadership dashboard is, what it does, explore a selection of real-world CEO dashboard examples to demonstrate the power of this valuable leadership tool followed by top tips to create CEO reports. We will focus on different aspects of various departments that need to present their data to the CEO, and empower chief executive officers that need different perspectives when making important decisions. Without further ado, let’s get started.
What Is A CEO Dashboard?
A CEO dashboard is an executive management tool used to measure, track, analyze, and visualize data to empower CEOs to make data-driven decisions with the help of interactive, high-level metrics from sales, marketing, finance, and other important business areas.
CEOs need a birds-eye overview of the most prominent CEO metrics that will help them make the best possible decision in order to improve business outcomes and a comprehensive leadership dashboard is one of the solutions that can certainly help.
Additionally, dashboards can serve as CEO reports and now we will explain how.
What Is A CEO Report?
A CEO report is a critical part of a CEO dashboard, serving up historical trends, and real-time insights in a way that’s visual, digestible, and easy to navigate. These reports can be delivered in the form of an interactive dashboard or .pdf file, for example.
It’s possible to tailor CEO dashboards reports to your specific business needs, goals, and requirements, working with CEO KPIs that will help you uncover priceless trends and insights with ease. To do so, CEO dashboard software will prove to be a critical leadership tool for the digital age but we will go into details later. In essence, it offers the following benefits:
- Improved decision-making.
- Wider accessibility to important data.
- Mobility through 24/7 mobile dashboard access.
- Improved internal communication that will make the organization stronger.
- Enhanced business intelligence that will lead to growth and boost your bottom line.
Try our professional dashboard software for 14 days, completely free!
Essential CEO Dashboard Examples & Templates
Now that we’ve considered the question, ‘what Info does CEO need in a dashboard?’, it’s time to explore some real-life CEO dashboard templates. These 4 very different but equally powerful CEO dashboard examples are interactive, visual, and provide a level of insight that fosters enhanced business leadership in a number of areas.
Let’s start with our CEO KPI dashboard focused on finances and satisfaction levels.
1. CEO Dashboard For Financial Health & Team’s Success
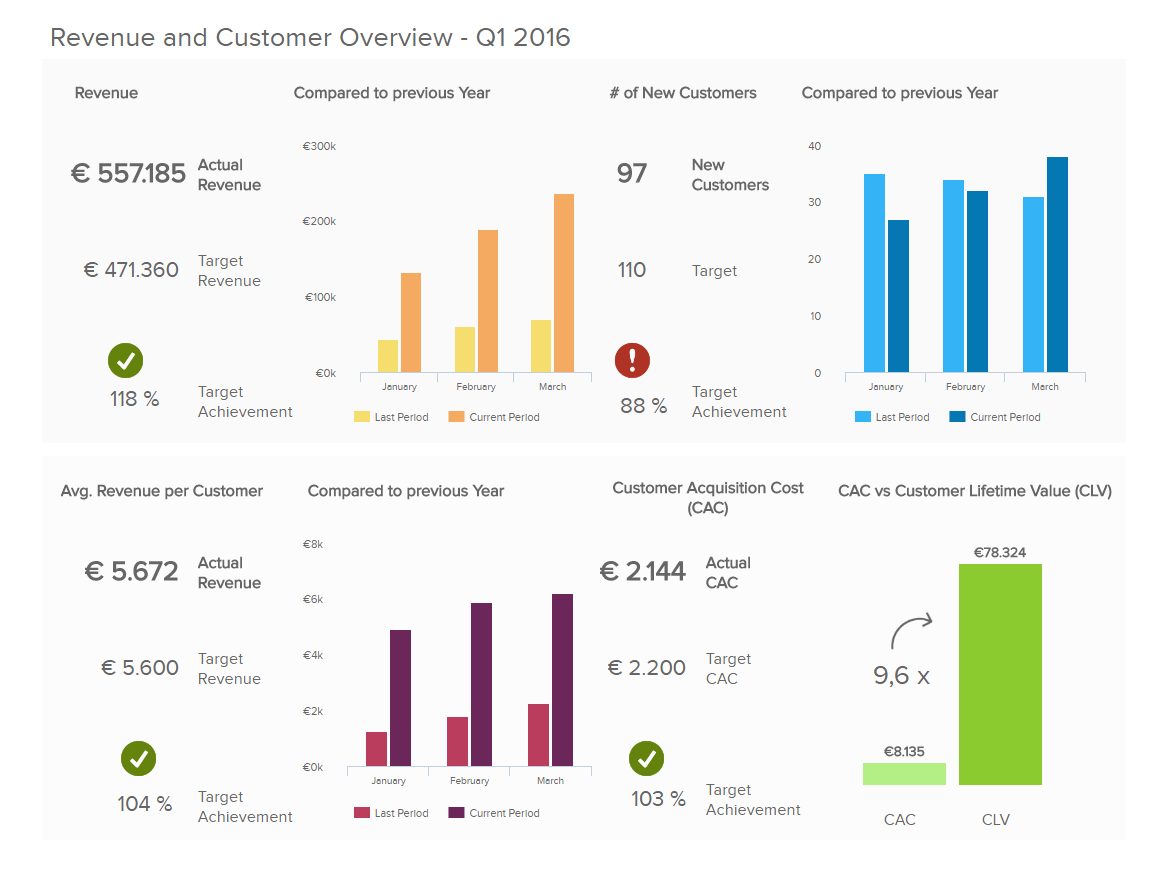
CEOs need to track the financial performance of a company, but also focus on the team and customers to generate the best possible insights and move the business forward. In our first CEO corporate dashboard, we focus on exactly that.

**click to enlarge**
By monitoring financial health with the help of high-level financial KPIs such as the revenue, EBIT, net income, and cost breakdown, each CEO has immense data to monitor and optimize the financial performance of a company. Additionally, modern CEOs need to stay connected to the team and customers to know their satisfaction levels. This is important in our digital age as employees will switch companies if they’re not satisfied. The same you can assume for customers.
CEO metrics explained:
- Gross profit margin:
This financial chart expounds on the total sales revenue you keep after accounting all costs related to your product or service. It’s an important metric to track since you can evaluate how efficient your operational processes are.

For example, you need to include in your calculation all prices of materials and labor of your production facility but exclude expenses such as rent. The higher the margin, the more income you retain from your sales dollars.
- Operating expense ratio:
The operating expense ratio needs to be included in every CEO report template you will create from the financial perspective as it will show you how well you manage your operating expenses in comparison to the total revenue.

This metric is particularly interesting for investors since they usually want to know how high are your operating costs in connection to the generated revenue, as mentioned. It’s important to include this metric in your financial reports since CEOs need to obtain a clear-cut overview of whether the company is scalable. If you can keep operating expenses on a lower level, the company will realize more profits.
- Cash conversion cycle:
Converting resources into cash is the focus of the cash conversion cycle (CCC). A CEO report to the board of director will usually depict the CCC in order to show how much time does the company need to convert its inventory investments (and other resources) into cash flows from sales.

This strategic visual tracks the performance over the course of the past 3 years automatically. It’s created with a professional dashboard creator that enables you to save time and resources from manual calculations and immediately spot that the illustrated cycle is becoming healthier with each year.
2. SaaS Management Dashboard For Sustainable Growth
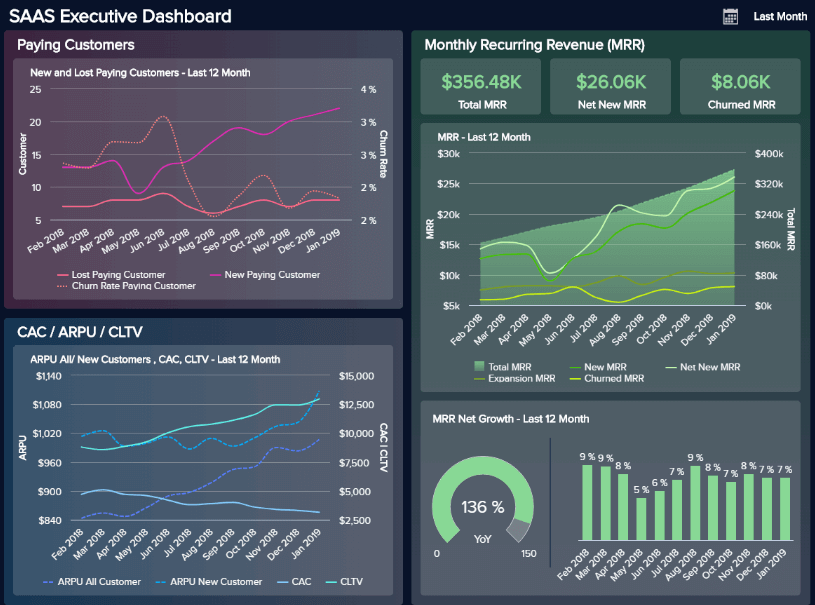
As digital technology evolves, the SaaS sector continues to evolve. If you’re the CEO of a budding software-of-a-service company, this CEO dashboard template will help you meet or even exceed your goals consistently.
**click to enlarge**
With 4 KPIs designed to track and measure customer churn, acquisition costs, recurring monthly revenue, and average revenue per unit (among other key insights), this dynamic CEO dashboard sample offers all the key ingredients for growth, efficiency, fluidity, and strategic planning.
Whether your SaaS venture is brand new or you’ve been around for some time and are looking to expand your audience, this management dashboard will help you achieve and even surpass your goals on a regular basis.
CEO KPIs explained:
- Customer acquisition costs:
The customer acquisition cost is a KPI critical for any serious SaaS business that needs to know how much costs are incurred before convincing a prospect to buy the product or service. A chief executive officer report focused on the SaaS area needs to monitor this metric regularly in order to generate invaluable insights.
- MRR:
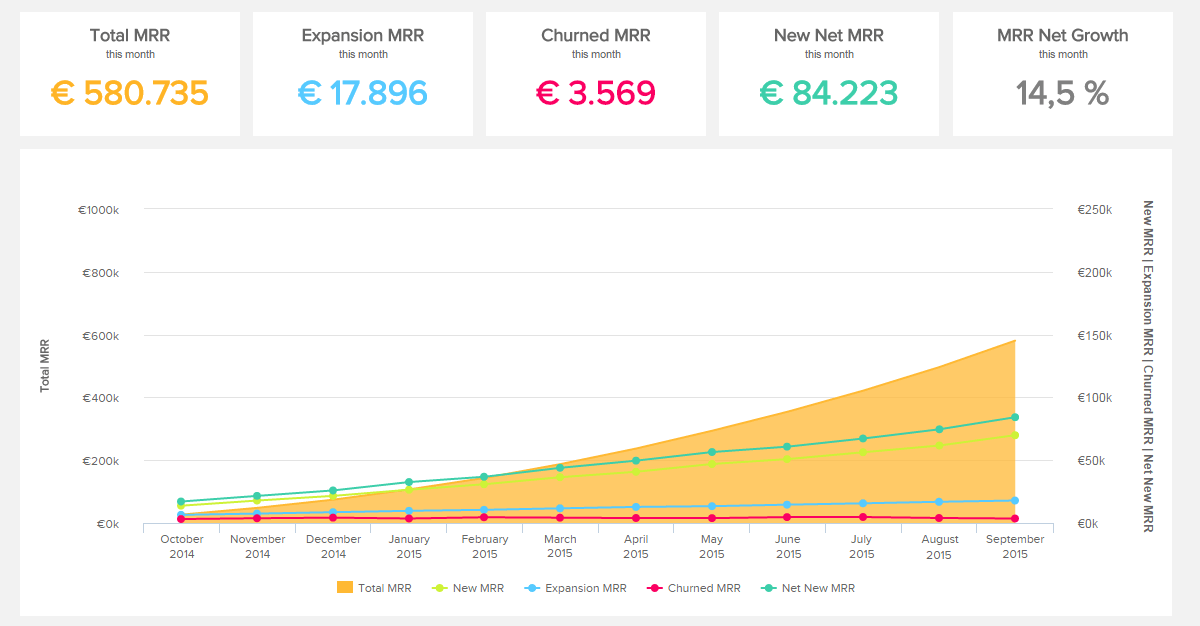
CEOs in a SaaS company usually keep a close eye on the MRR since it gives a good indication if a business is developing in a healthy way, especially since it will enable you to make accurate financial forecasts based on users’ subscriptions.
**click to enlarge**
A comprehensive SaaS dashboard will include the MRR as one of the most important metrics in SaaS management, especially on a C-suite level where the monthly recurring revenue plays a pivotal role in successful business development.
- ARPU:
The average revenue per unit (user or account) is a CEO metric critical for indicating the customer’s revenue from all your sales. The point is to keep the acquisition costs lower than your ARPU in order to make stable profits.
3. Investor Relations Dashboard For Powerful Presentations
Our second CEO dashboard sample focuses on one of the most critical components of any thriving business – investor relations.

**click to enlarge**
The investor relations CEO dashboard template serves up a priceless mix of high-level metrics that will help you keep your professional relationships healthy while ensuring your asset-driven financial affairs are fluent and protected at all times.
By drilling down into your existing assets, your return on assets and equity, and your price-earnings ratio, this powerful executive-level CEO dashboard example will help both you and your shareholders thrive indefinitely.
CEO metrics used:
- Return on assets
- Return on equity
- P/E ratio
- Debt-equity ratio
- Share price
- Working capital ratio
4. CMO Dashboard For Top Marketing Performance
Without a doubt, in our cutthroat digital age, investing ample time and funds in your business’s various marketing strategies is essential.
Our next example focuses on a marketing dashboard, a CMO-centric tool that will help you consolidate, organize, and analyze colossal datasets in one intuitive central location. This is actually a report to CEO example that is a good blueprint to present the marketing performance to the CEO in a more detailed way if there are specific marketing related questions.
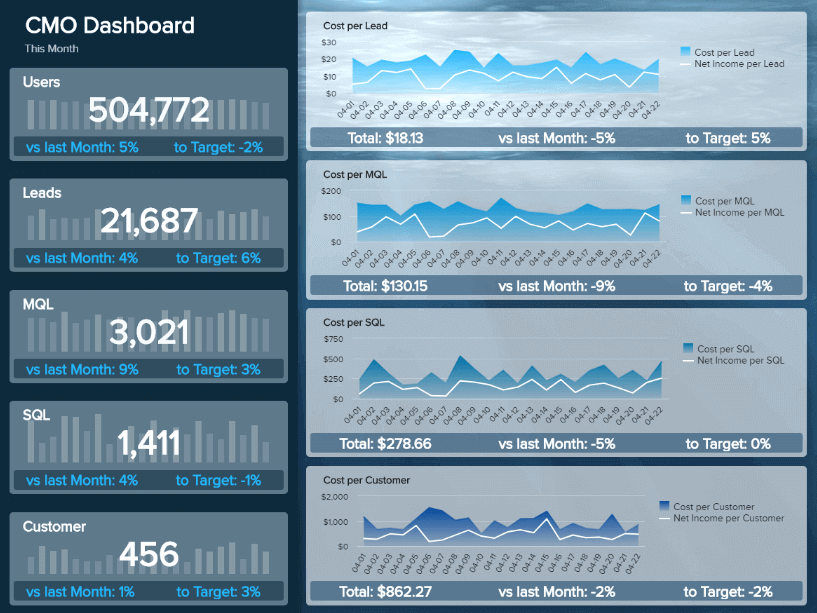
**click to enlarge**
Boasting the perfect mix of top-level insights, this comprehensive CEO dashboard example will help you optimize your marketing performance, which will help you significantly boost your brand awareness and bottom line. An essential dashboard tool for CEO and any business leader’s digital toolkit.
CEO KPIs explained:
- Customer lifetime value:
Another critical metric within the marketing C-level suite, the lifetime value of a customer needs to be included in a CEO corporate dashboard since it’s a precious indicator of achieving success in business. The longer you can keep a customer, the more revenue you will generate.
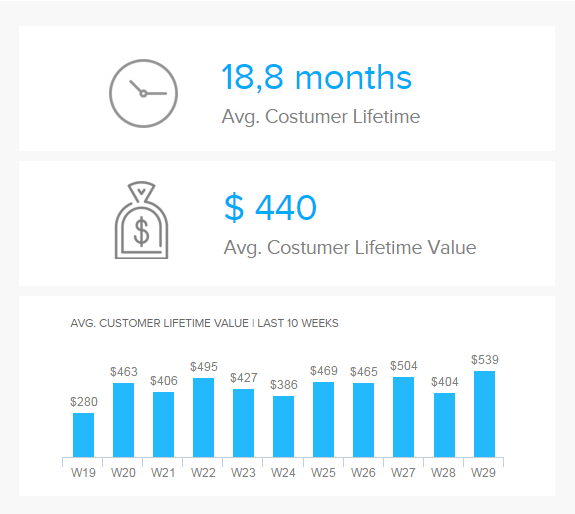
CEOs need to grasp into marketing and closely monitor the customer lifetime value as it will help you to identify the most profitable marketing channel which you can additionally examine on an operational level. Additionally, it will help you determine where to allocate the budget and how.
Additional metrics in our example:
- Sales target & growth
- Website-traffic-to-lead ratio
- Cost per lead
- Lead-to-MQL ratio
- MQL-to-SQL ratio
To learn more details about additional metrics, you can check out our rundown of the most important marketing KPIs.
5. Sales KPI Dashboard For Increasing Revenue & Profits
As you’ll no doubt know as a CEO, sales are integral to the existence of your organization – after all, without sales, where would you be?
Our sales dashboard hones in on every vital top-level area of sales, providing insights that will help you reduce customer churn, improve economic efficiency, optimize your sales campaigns, and capitalize on revenue-boosting activities such as upselling and cross-selling. This dashboard will enable you to create sales reports that are easy to digest and enhance your decision-making processes.
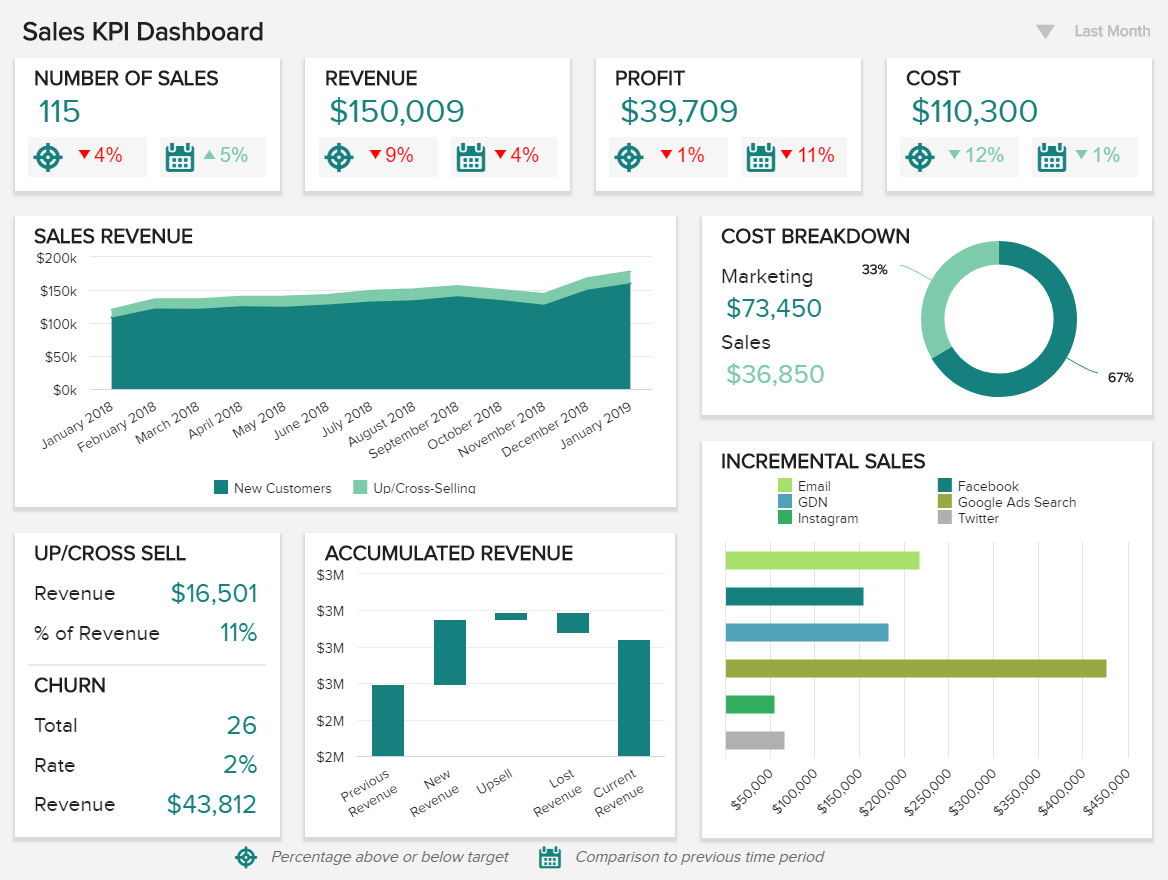
**click to enlarge**
As a business leader, keeping a keen eye on your organization’s sales activities is crucial. This CEO report example will ensure that you not only measure these metrics with ease but also uncover fresh insights that will help to increase your bottom line.
KPIs used:
- Sales target:
As sales are an important part of every business strategy, CEOs need to take into account also if their team has reached planned goals. To make matters more simple, a visual CEO report example such as the one below should be high on the strategic sales performance tracking list.
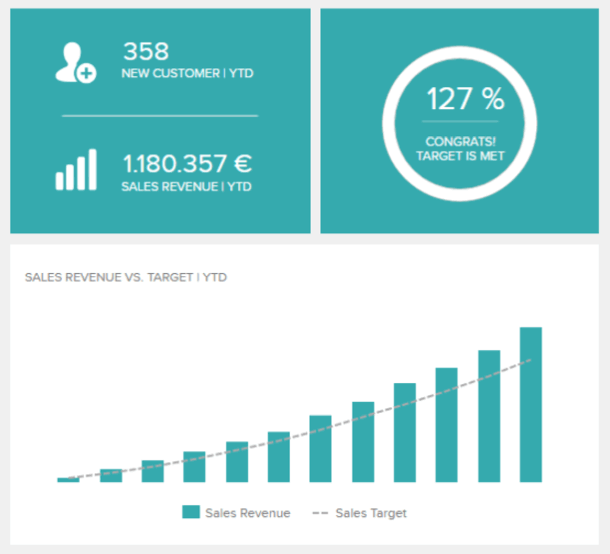
This metric will help you determine if your sales processes are on the right track or need more adjustments. The goal is, of course, to outperform your forecasted amount.
- Customer churn rate:
Losing customers is never easy but it’s important to track this metric in order to evaluate the trends within your business and upscale your retention strategies.
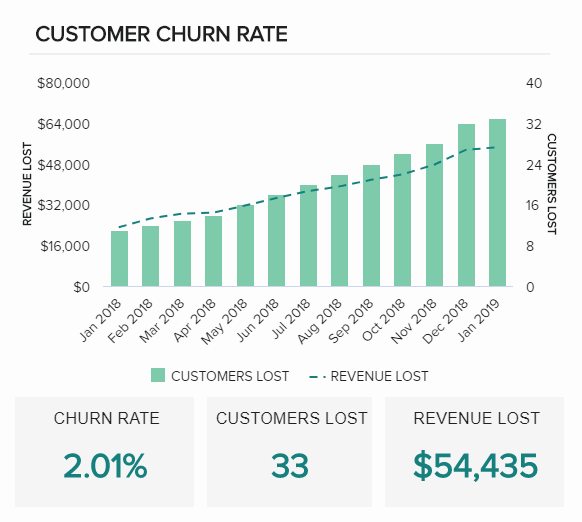
By automating these calculations with the help of modern KPI dashboard software, the churn rate will be immediately shown with up-to-date information, without the need for tedious manual work. In our example above, we can see that the churn rate is 2%, but it will depend on your business area and industry.
Additional metrics in our example:
- Upsell & cross-sell rates
- Profit margin per sales rep
- Incremental sales by campaign
“Data that is loved tends to survive.” – Kurt Bollacker, computer scientist
To get deeper into CEO dashboards solutions that these examples above were created with, we will take a deeper look into the features that a CEO dashboard software should possess in order to generate business value for every chief executive officer, no matter the industry or size of a company.
What To Look For In A CEO Dashboard Software?
 As mentioned earlier, every CEO needs a birds-eye overview of the complete business, and modern software and tools help him/her to save time, consolidate multiple touchpoints, and generate actionable insights within minutes. To create examples we discussed above, a professional CEO dashboard software should have these components and/or elements:
1. Advanced interactivity levels
The best dashboard software for CEOs needs to have advanced interactivity features such as drill-downs, time interval widgets, chart zoom, etc. These features are the very essence of viewing data from different angles while interacting with the screen as business questions arise, whether at a meeting or during the analysis process.
2. Cross-device accessibility
Chief executive officers need to have access to information from anywhere, and anytime. Professional software ensures that data is available from multiple devices, whether mobile, desktop, or tablet. That way, C-suite has immediate access to business information and doesn’t have to “shoot in the dark.” Thanks to modern cloud solutions, and a simple Internet connection, CEOs have their data available – immediately.
3. Predictive analytics and forecasting
Chief executives need to predict future business scenarios in order to avoid potential bottlenecks and create a sustainable business environment. Technologies that have emerged in recent years offer forecasting features that can ease a CEO’s life and provide an additional perspective for future business development. Based on past data points, the software automatically calculates predictions and presents data visually, therefore, you can immediately spot what will happen with your data from sales, marketing, finances, procurement, or any other industry that modern CEOs need to lead and upscale.
4. Multiple sharing options
When you create a certain CEO report to board template, you want the possibility to quickly and efficiently share. Customizing reports, recipients, and the information you want to share ensure complete control over the data you want to present as well as the level of access to the specified recipients. In practice, that means that you can share the complete chief executive officer dashboard through a public URL, enable specific rights within the viewer area, and, finally, embed the dashboard within another application, intranet or website.
The listed features are some of the most prominent ones you should look for if you need to present your data to the CEO or if you’re a CEO that needs to share insights with the executive board. Now we will focus on what information to include in such dashboards and finish with tips to make your executive efforts more valuable, and more effective.
What Info Does CEO Need In A Dashboard?
It’s clear that CEO dashboard software offers a variety of business-boosting benefits for those in a leadership role. However, to enjoy optimum success, it’s vital to understand what you should include in your management reports. So, what info does CEO need in a dashboard?
Let’s explore by looking at the core information you should include in your CEO dashboard reports:
1. The right KPIs & metrics
To ensure that your dashboard delivers the right insights for your individual goals, working with the right KPIs is an absolute must. If your dashboard includes KPIs that are irrelevant to the insights you’re looking to gain, it will be essentially useless.
Sit down with your senior team in a collaborative environment and examine your current processes as well as your proposed business goals. Once you’ve established your aims and gained a greater understanding of your processes across the board, you’ll be able to select the KPIs that will best suit your needs and help you drive the business forward and create a powerful CEO report template.
You can also check our rich library of various KPI examples based on different departments, sectors, and functions for your consideration.
2. The right design & visualizations
Once you’ve selected the right KPIs, you’ll need to set up your dashboard and customize it to your preferences. Different KPIs will offer different visualizations, depending on their nature or function.
To ensure quick and effective access to your most valuable data, designing your CEO dashboard metrics and template – correctly – is essential. By following the most prominent dashboard design principles, you will stand a greater chance to get a clearer picture of your company’s processes, inside-out.
3. Management, marketing, finance & sales in one
As a CEO, you’ll need access to a wide range of company data, spanning departments. In doing so, you’ll get a well rounded, panoramic view of the organization’s progress while gaining the ability to formulate key strategies in a number of critical areas.
To thrive as a data-driven business leader, you will need to include KPIs and information balanced across management, marketing, sales, and finance – make sure you cover all bases.
Naturally, the specific analytical reports and data included in your dashboards will be tailored to your aims as a CEO. However, the takeaway here is that you must make sure that your CEO software serves up the perfect mix of insights, rather than leaning towards one particular area to avoid stunting your professional vision.
Top 5 Tips To Create Effective CEO Reports

We have expounded on the various CEO reports examples and templates, but to fully leverage the power of creating such reports, you should keep in mind these tips:
1. Concentrate on the big picture
CEOs aren’t interested in vanity metrics or low-level ones. They need to be ensured the company’s strategy is on track, but the details and operational activities kept under control by managers and staff members. By utilizing high-level KPIs, each CEO can create a full story where the business is going and what needs to adjust. That being said, don’t present the bounce rate data from your website or inform him/her that a specific product is out of stock, but focus on strategic insights that need to be monitored by a chief executive such as customer costs or values.
2. Take appropriate time intervals
As we saw in our CEO report examples above, none of them are based on a daily level. Chief executives don’t need to be alarmed on each daily report that departments need to follow in order to properly manage their part of the business. Usually, it is wise to use weekly, monthly, or quarterly intervals, depending on the level of responsibility CEO delegates. It can also differ from business to business, so it might make sense to communicate and adjust accordingly.
3. Don’t concentrate only on past performance
CEO reports should also take a look into the future and indicate predictions. By setting realistic goals, and also the resources which are needed to achieve those goals, the report can provide a clear business picture and a roadmap for the next level of development.
4. Integrate all core areas of your business
Each business needs several core areas to function properly and generate growth. A SaaS company will have different core areas than retail, but as we already mentioned in the article, sales and marketing are usually always important. Other relevant areas might be customer support, HR, IT, procurement, etc.
Having a clear structure of these areas is of utmost importance. By using various dashboard tabs and internal widget linking, your business story can be presented much easier, accompanied by effective visuals that ensure efficient dashboard and data storytelling.
5. Enable data-driven decisions
CEOs must be given everything they need, and concisely. But more importantly, giving them the possibility to drill down into central KPIs on their own or during a business meeting with other C-level executives by taking advantage of modern, interactive dashboards, and by avoiding static reports, insights and possibilities are endless.
Try our professional dashboard software for 14 days, completely free!
If you’re a business leader looking to push your business to the next level, data is indeed your friend. Dashboards for CEOs will help you manage the endless amount of data available at your fingertips, empowering you to extract actionable insights that will help fortify your business decisions while communicating your discoveries to the talented executives in your organization.
As a result, you will improve interdepartmental communication, increase the efficiency of your processes, propel your commercial reach, boost your bottom line, and guide your organization into a bright and prosperous future.
Data is the new oil, and a leadership dashboard is the vehicle that drives it – don’t miss out.
Want to take advantage of modern business dashboard features and create reports that will impress and provide your CEO with stunning data, just within clicks? Explore professional business reporting and try our software for a 14-day trial, completely free!
The post Modern CEO Dashboards & Leadership Reports- Examples And Templates appeared first on BI Blog | Data Visualization & Analytics Blog | datapine.