
Projects are one of the cornerstones of a successful business. Sector or industry aside, strategic initiatives focused on specific areas of the business help drive an organization forward, growing, progressing, and evolving year after year. Also, implementing effective management reports will create a data-driven approach to making business decisions and obtaining sustainable business success.
But despite the business-boosting potential (and vital importance) of successfully delivering collaborative strategies, a mere 58% of organizations understand the value of project management to its fullest, according to the global survey conducted by the Project Management Insitute. Armed with this knowledge, you can gain a significant edge on the competition and boost your project exponentially.
By taking an online data visualization approach to handling your company’s strategic activities, big or small, you will make your business more cohesive, collaborative, intelligent, and profitable – and project management dashboards will help you do just that. With the help of modern solutions, you can monitor, optimize, and enhance your projects’ performance while increasing the productivity of the whole team, saving countless working hours, and, ultimately, costs.
With these notions in mind, we will explain the fundamental dynamics of project management dashboards, explore the best examples and templates but also dig into the benefits of project dashboards as well as how to create one. But first, we will answer the basic question: what is a project dashboard?
After reading this article, you will be equipped with the know-how on utilizing modern project management dashboard software and a complete roadmap to get you started in this exciting field of work.
Let’s get started.
Try our professional dashboard software for 14 days, completely free!
What Is A Project Management Dashboard?
A project management dashboard is a data-driven platform that displays metrics, stats, and insights that are specific to a particular project or strategy by presenting a tailored mix of KPIs in one central location in order to benefit the project’s performance.
Such a dashboard is perfect for individual departments looking to monitor the success of their projects and campaigns, spot past or present trends, and ultimately contribute to making the organization more intelligent. Project dashboard software is also effective for interdepartmental collaboration due to its flexible access and usability, but we will explain this notion later in our article.
For now, we will look at the top examples from various functions and provide you with details on each.
The Best Project Management Dashboard Examples
To put all of the qualities and features of a PM dashboard into real-world context by exploring these 4 essential project dashboard examples. They provide an overview of projects conducted in IT, marketing but can be used for other projects as well so you can use them as templates. Let’s see this in more detail.
1. IT project management dashboard
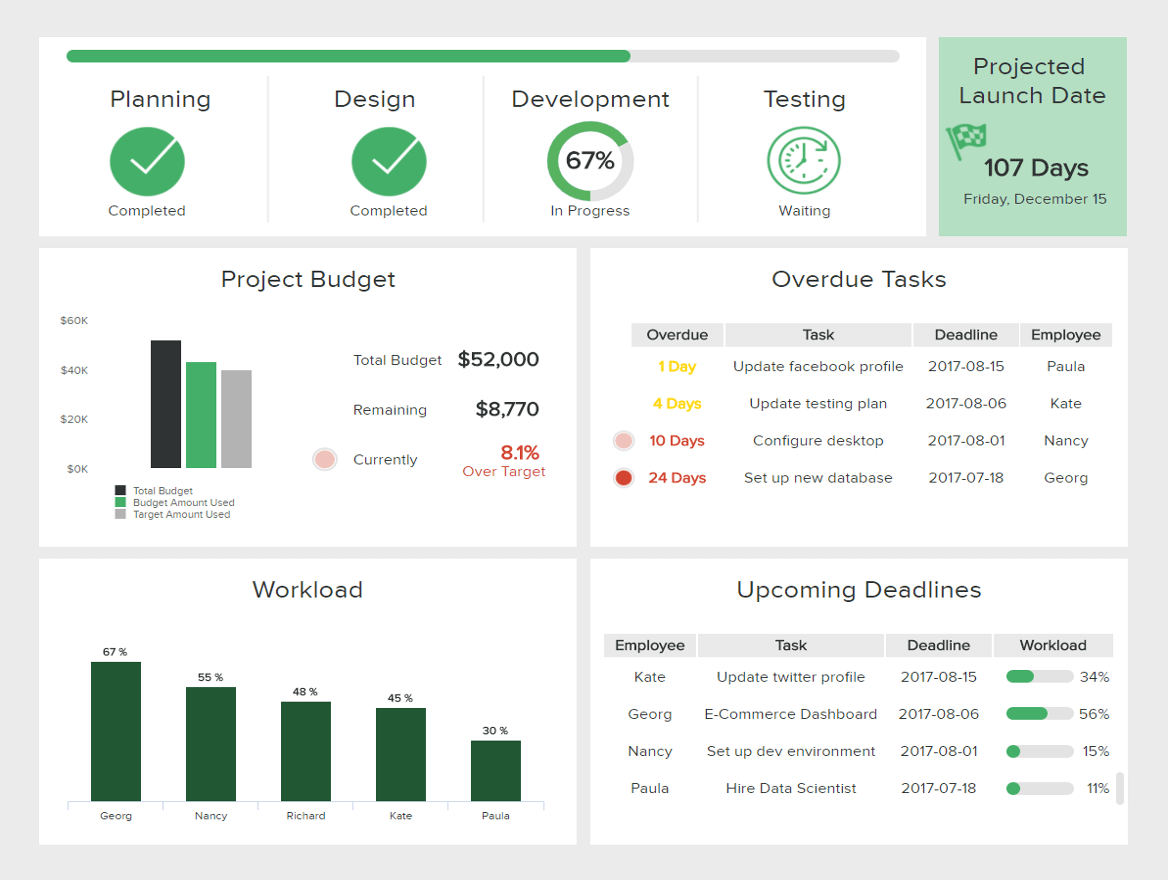
This project dashboard template is the first of our 4 project dashboard examples, and it focuses on the steps and tasks involved in delivering a very specific strategic IT-based initiative successfully from start to finish.
Click Here To Open The IT Project Management Dashboard In Fullscreen
Regardless of your industry or sector, if the Chief Information Officers (CIOs) want to deliver more value and have a more significant impact on the business, they must align with the company’s core strategic priorities. To achieve this, IT-driven dashboards make priceless tools.
Every IT KPI and visual element in this IT-based project management tool helps to drive efficiency, communication, and cohesion, drilling down into task-management and delivery, deadlines, and specific workloads.
By gaining a panoramic view of these insights, it’s possible to make your company’s IT projects more time-efficient, cost-effective, and results-driven than ever before. Let’s explore the core KPIs of this IT dashboard in more detail:
a) Total Tickets vs. Open Tickets:
This particular KPI helps enhance the overall performance, efficiency, and delivery of your IT projects by carefully monitoring progress and workloads. It will form the foundations of your project’s overall success.
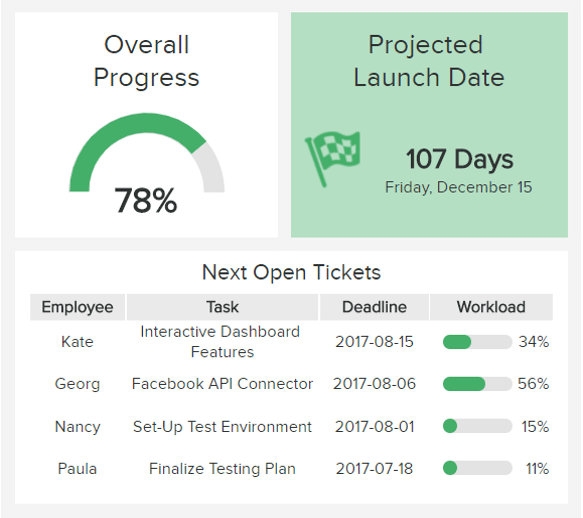
By monitoring this KPI, you can easily spot unresolved tasks and avoid piling them up that will cause issues across the project. You can immediately identify the workload of your team and adjust deadlines or talk to your employees and see if they need more help if needed. That way you can prevent issues within the projected launch data and adjust your tickets accordingly.
b) Projects Delivered on Budget:
This invaluable KPI offers a detailed, accurate evaluation of your ability to remain within budget limits. If you learn how to stay within budgets, your projects will be all the more effective and efficient.

The costs are a critical part of any project. Of course, unexpected expenses happen all the time and can cause a change of plans and additional optimizations. In that case, it would make sense to create a margin to take those unexpected events into account.
c) Average Handle Time:
The average handle time KPI provides an invaluable insight into how well you’re handling your projects in terms of timeframes, delivery dates, and deadlines. An essential component of successful project management.
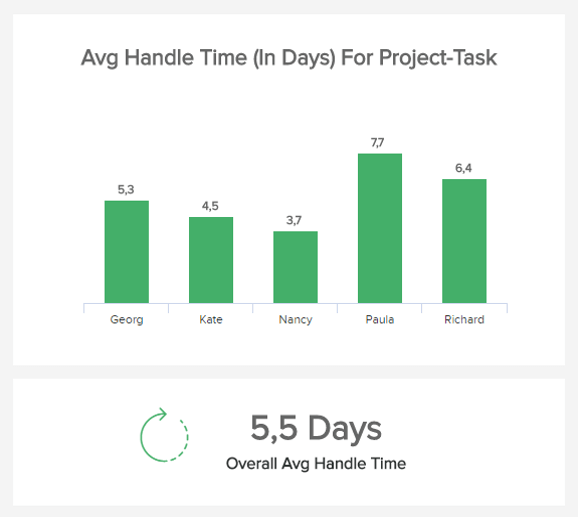
This metric is invaluable for every project manager since you can optimize your future tasks and workload of each team member. In this example above, we can see that some team members struggle to complete their work so you can investigate further and offer additional help.
d) Reopened Tickets:
Reopened tickets will show you how effectively a specific task is handled, saved correctly, and don’t get reopened later. It’s crucial to monitor this regularly so you can see if your team handles tickets efficiently or they need additional help.

In this specific example above, we can see the overall progress over the course of 12 weeks, the percentage of reopened tickets, and the comparison with the last month. The lower the numbers, the better your ticket management works.
e) Accuracy Estimates:
Another crucial element that successful projects should implement in their monitoring processes is the accuracy estimates. Team members estimate how much time will it take them to complete the task. If it takes longer, you need additional adjustments.

In our example above, we can see that some developers didn’t estimate in the best way possible – Thomas’ calculations are missed by 1/5 while others are above 90% which is generally a good result. These estimates can be implemented in various projects, including marketing where agencies need time estimation for their clients.
Speaking of marketing, we will now take a closer look at how agencies can upgrade their project performance with the help of modern dashboard solutions.
2. Marketing performance dashboard for agencies
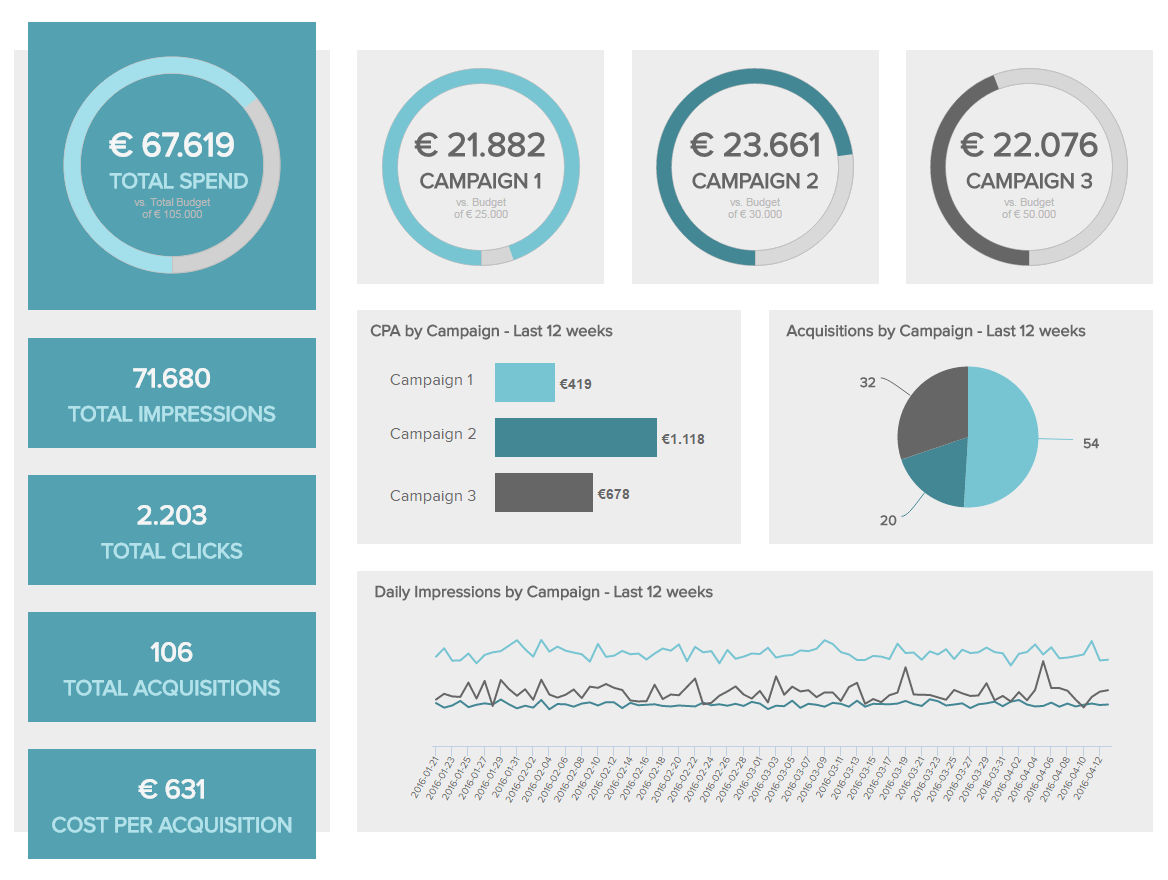
Without effective, target-driven marketing strategies, your business would never grow or evolve. This marketing dashboard template focuses specifically on your organization’s promotional initiatives. Agencies use it to monitor and manage the performance of multiple campaigns and projects for their clients in order to create comprehensive marketing reports used in this fast-paced industry.
Click Here To Open The Marketing Performance Dashboard In Fullscreen
The marketing performance dashboard is an invaluable project dashboard template as it gets straight to the heart of the agency’s promotional campaigns’ cost-efficiency, target-meeting capabilities, levels of engagement, and click-through rates.
This marketing dashboard provides an ideal overview of all your campaign performance data across every relevant marketing channel. Moreover, it showcases all of the insights you need to decide where to place your marketing budget in the most informed, strategic way possible so that you can present your results to your clients quickly and efficiently. Let’s glimpse at the KPIs that make this integral dashboard tick.
Primary KPIs:
- Click-Through-Rate (CTR): An essential marketing metric, your click-through rate offers a clear-cut indication of how much your promotional content, assets, and communications are resonating with your target audience.
- Cost-per-Click (CPC): This is an essential marketing metric as it offers a comprehensive overview of how much your various promotional ad spend is costing on each channel and how effective each activity is to the success of your project.
- Cost-per-Acquisition (CPA): By understanding how much your various promotional initiatives are costing you in terms of acquiring a new customer or conversion, you can make strategic tweaks that can save you money while boosting your success. Your CPA will help you do just that.
Try our professional dashboard software for 14 days, completely free!
3. Brand analysis project dashboard
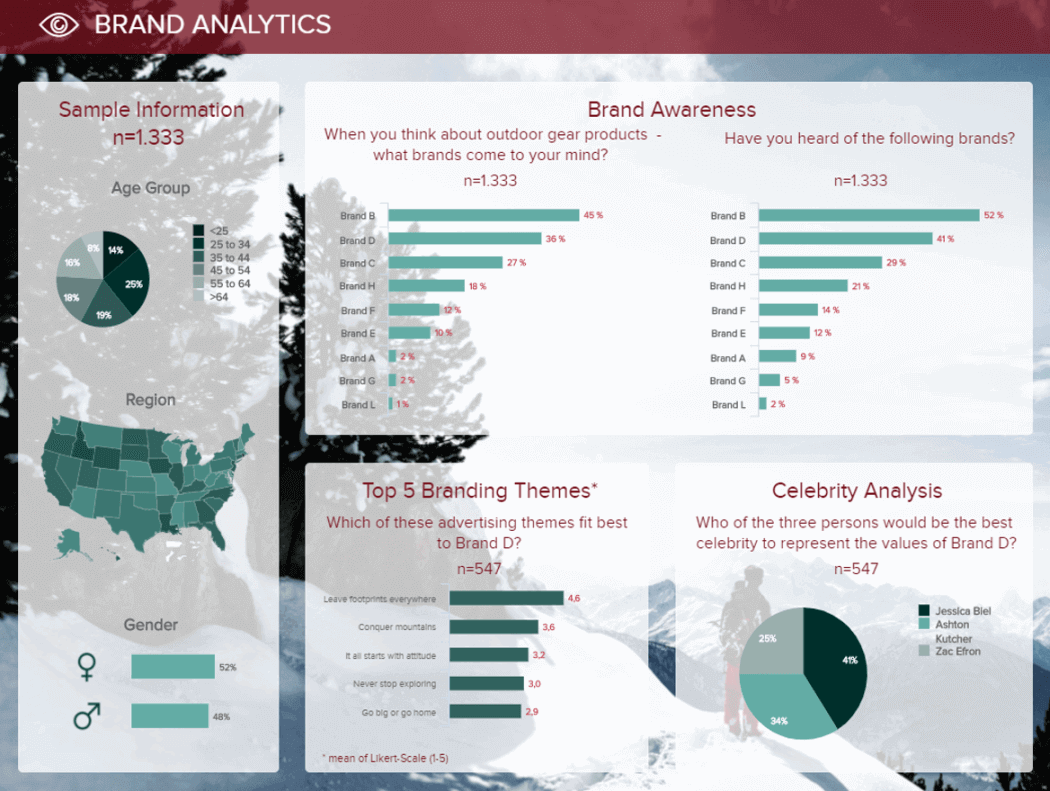
When it comes to presenting survey results, market research agencies often rely on static presentations and deliver each project results in traditional slides and tables that cannot provide immediate answers to all of the questions asked. Our next project management dashboard template focuses on the in-depth brand analysis project that provides interactive capabilities and makes a project presentation much easier and more effective both for agencies and clients.
Click Here To Open The Brand Analysis Dashboard In Fullscreen
The abundance of questions, analysis processes, and presenting results oftentimes cause market research agencies a long and tedious process to manage such projects in the most efficient way. A project management dashboard tool can easily create a clear overview of survey results, steps taken, and visualize the complete project with a simple, yet effective dashboard designer. Let’s take a closer look at the KPIs that make this agency project so invaluable.
Primary KPIs:
- Unaided Brand Awareness: A direct survey that requires active thinking from people you have interviewed and measures the brand recall with an open question. Interviewees give the list of names of all the brands that come into their mind, without any biased or helping hand.
- Aided Brand Awareness: After an open question, it makes sense to evaluate how consumers recognize your brand but this metric doesn’t require active thinking from interviewed people. If you see a higher percentage of recognizing one brand over the other, consumers probably paid attention to delivered campaigns.
- Brand Image: Impressions of consumers put their perception into adjectives and ideas that they have connected with a specific brand. To put this into perspective, it makes sense to compare your brand image with competitors and see if they perceive your brand according to your marketing campaigns.
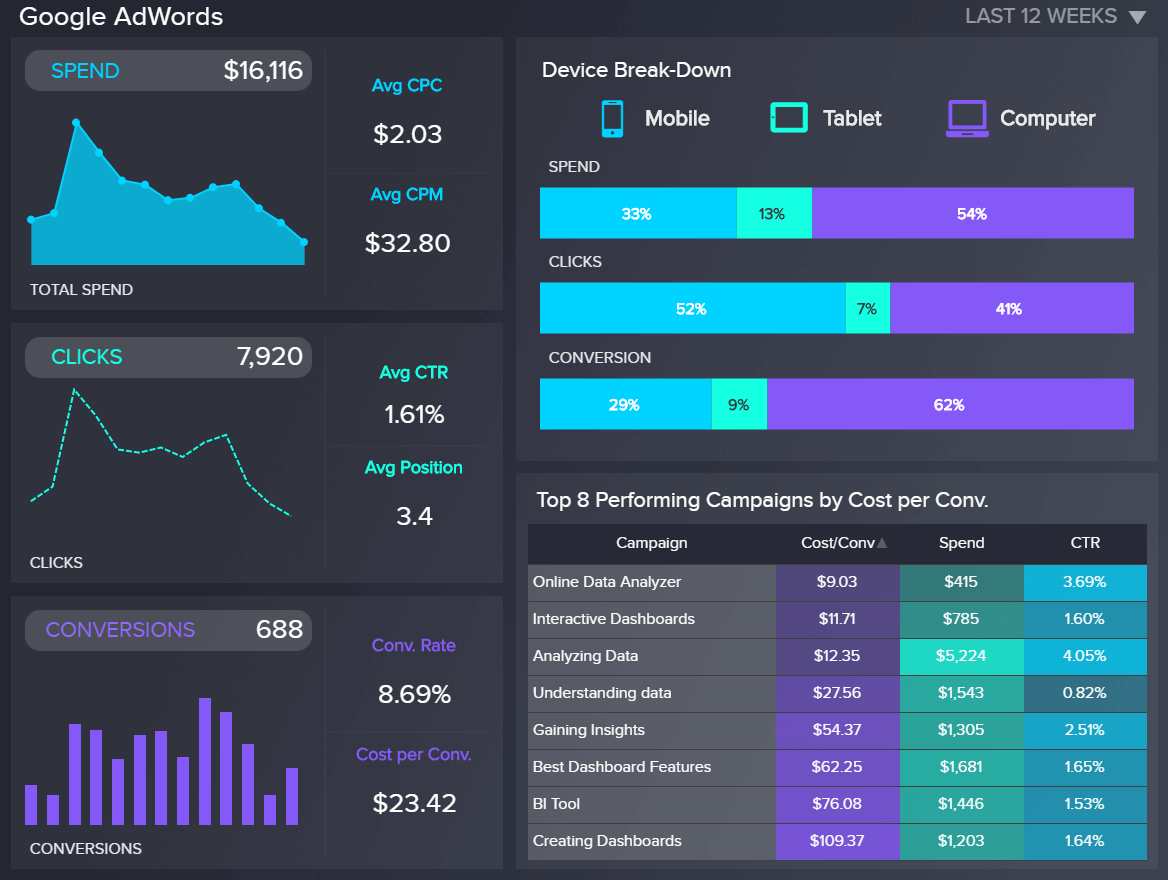
4. Google Ads dashboard for SEA campaign projects
If you decide on a marketing project with Google Ads (formerly known as AdWords), you need a clear overview of the stats, metrics, budgets, and overall campaign performance. A project status dashboard such as the one below will prove to be beneficial for your SEA projects and enable you to focus on the most important data and results that it brought. Let’s see this through an example:
Click Here To Open The Google Ads Dashboard In Fullscreen
If you’re a campaign manager, whether in-house or agency side, you need to take a closer look at each campaign’s performance in order to deliver successful advertising projects. In the heart of this dashboard lie conversions, both for individual campaigns and aggregated, but you can also see the device breakdown and spending budget.
Primary KPIs:
- Conversion Rate: This metric will show you the level of performance of the desired target action (white-paper download, e-mail subscription, or product purchase, e.g.) and you should take into account that not all actions will deliver a high percentage of conversions. An e-mail subscription conversion will behave differently than a product purchase, for example.
- Cost per Conversion: To see how your budget performed on a campaign level, a cost per conversion will tell you which campaigns are most effective. It makes sense to compare different campaigns in order to see how to spend your budget in the most efficient way.
- Budget Attainment: This metric is a general controlling figure in your marketing projects. A dashboard for project management will certainly implement this KPI in order to see how exactly the budget targets are implemented.
These project management KPI dashboards are applicable in various departments, you can simply adjust them based on your project requirements and deliver the best possible results with the help of modern management reporting tools.
To take your project control dashboard to the next level, we will now focus on the tips to create such dashboards and enable you to improve your projects, no matter the size of your company or department you work in.
Try our professional dashboard software for 14 days, completely free!
How To Create A Project Management Dashboard?

It’s clear that a project management dashboard is a powerful online data analysis tool. But this intuitive data-driven software is only effective if it has the right attributes, qualities, and functionality for the job. To help steer your success, here are the 6 main tips you should focus on while creating such a dashboard:
1. Take into account digestibility
When you’re in the middle of delivering a project, chances are the pressure will be on, which means that to hit your targets and get things done, gaining instant access to the right information is paramount. Any robust project management tool will be visually digestible, well designed, and serve up insights in a way that lets you extract value from them in seconds.
2. Make sure to focus on usability
In addition to digestibility (or ‘scannability,’ as it’s sometimes referred to), it’s essential for project management dashboards to be completely user-friendly. Not only should everyone within the organization be able to navigate your online dashboards with relative ease, but it shouldn’t take technical staff to intervene and conduct data-driven tasks on a regular basis. In short, any project dashboard worth its salt will allow all departments to work with the data that’s most important to their role in a particular project, without fuss.
3. Choose the right set of KPIs
No matter the type of project you’re working on, you need to set proper key performance indicators. Each of your data sources will have specific metrics you need to track. By utilizing a dynamic dashboard for project management, metrics can be easily consolidated into a single point of access. While there are numerous examples that you can select from, only a number of KPIs will make sense for your specific project. From the specific project status, team performance, and specified assignments to marketing agency campaign management, it’s important to select a few KPIs that will convey a data-story and enable you to drill into details, if needed.
4. Customize each element on your dashboard
Finally, it’s essential for your project management dashboard to be fully customizable. By customizing your BI dashboard, you’ll be able to set KPIs that are most relevant to your project while integrating platforms and services that are most useful to your activities and choosing designs or layouts that will prove the most helpful to you and your colleagues. The important notion here is not to overburden the dashboard with information that’s not relevant, too many colors, or metrics that wouldn’t even fit into your story. As mentioned earlier, choosing the right KPIs as well as customizing the design and the position of each element will prove to be an efficient way to present your project and the performance of the same.
5. Automate your reporting processes to save time
One of the last elements when creating a project management visualization or dashboard, is the capability to schedule and automate your reporting processes. No matter if you need a daily, weekly, or monthly overview, simple automation will save you countless hours since you won’t be required to manually update the data or manage multiple spreadsheets at once. A professional BI dashboard software will enable you to focus only on your data and automate tedious tasks of creating and delivering reports on a regular basis. This is extremely important in project management as many different angles need to be aligned at all times.
6. Utilize professional project management dashboard software
Professional software will enable you to consolidate all of our mentioned points into a single, unified point of access where you can customize, automate, and choose a project status dashboard template if you don’t have time to design one yourself. If you need to create a more user-specific content, the software can provide you with the possibility to deliver embedded dashboards so you can easily implement them into your own application, website or intranet, for example. But not only, as another key attribute of project-based software is portability. A robust data dashboard will offer its users access on a variety of media, from desktop to mobile app, providing fully-optimized, user-friendly access to essential project data 24/7 no matter where you may be in the world. A simple connection to the Internet is all you need and you can access your project management software dashboard with just a few clicks.
These are just a few tips you should take into account when utilizing all the possibilities that a project management tracking tool can deliver based on your parameters in order to fully take advantage of creating such a dashboard.
As we focused on the definitions, examples, and tips to create a successful dashboard for project management, now we will focus on the why. By explaining the benefits of creating a PM dashboard, you will know why these data-driven dashboards are essential for modern management efforts.
Top 4 Benefits Of Project Management Dashboards
Dashboards for project management come with a host of benefits to any modern organization regardless of industry or niche. Here we explain the most prominent ones:
1. Communication & cohesion
The key to successful project management is communication. If everyone involved in a particular strategy or initiative understands their role, has access to the insights they need to perform their tasks to the fullest potential, and understands the data before them, your project is likely to exceed expectations and bust targets. Working with project dashboard software that can create extensive analytical reports will bestow your strategic activities with all of these key attributes.
2. Centralized data
In today’s digital business landscape, projects can become complicated due to the sheer number of platforms or touchpoints to consider, coupled with the significant piles of data available at any one time.
Project dashboards present and visualize the data that’s 100% relevant to a particular project, and as every insight is available in one central location, it’s possible to gain swift access to all of the insights or metrics that are integral to your project without logging into other applications or platforms. And this is the essence of what is a project dashboard – time and money saved.
3. Targeted information
By working with a specific KPI template that is relevant to the task at hand, a live dashboard makes it possible to track, measure, and improve your performance from start to finish.
Moreover, by gaining the ability to compare digestible visual data, you can spot trends, capitalize on strengths, identify weaknesses, and improve the success of your projects significantly.
4. Utilization of real-time data
While there are many different angles you can manage your project from, as mentioned earlier, the important point to stress is the possibility to use real-time data. Whether you need an immediate answer to your business question or you simply want to have the latest information without manually updating it, these dashboards will enable you to constantly pull real-time information. For example, if you want to track how much time is spent on a specific part of the project, real-time data will ensure you have the right information at the right time.
5. A holistic overview of the complete project
Whether you’re working on a social media or (already explained) IT project, you need to gain a complete overview of the tasks, budgets, milestones, strategic or operational KPIs that you need to track. In the past, you could create a traditional report and work with historical data in order to generate insights for the future, but today you can build a modern and effective social media report or dashboard, for example, and have all your touchpoints in a clear, concise visual overview. This will provide you with a quality backbone to holistically view different angles and ensure sustainable project development and overview.
“The single biggest problem in communication is the illusion that it has taken place.” – George Bernard Shaw
Try our professional dashboard software for 14 days, completely free!
Indeed, communication, intelligence, choosing proper data analysis methods from the very foundations of managing and delivering a successful project from start to finish, are the most important notions you need to consider in project management.
If you want all of your projects to surpass your goals and drive your business to dizzying new heights, project management dashboards are without a shadow of a doubt the way forward. Embrace the power of project management technology, and great things will happen for you and your business.
If you want to start building your own dashboards and take control over your projects, you can try our software for a 14-day trial, completely free!
The post How To Create A Project Management Dashboard – Examples & Templates appeared first on BI Blog | Data Visualization & Analytics Blog | datapine.