“In Social Media, the “squeaky wheel” gets the oil. You have to put yourself out there, to find people who will relate or even debate with you, depending on what you are looking for.” – Jessica Northey
There are billions of social media users across the globe, most of which share their thoughts, feelings, opinions, and recommendations with friends and family. As a brand or business, if you meet your target customers on the platforms on which they’re most engaged, you stand to grow your audience and boost your bottom line exponentially.
By sparking up meaningful conversations and delivering valuable content with your prospects at times that they’re most likely to respond or react, you will ensure your social success – and in turn, help your business to scale, evolve, and thrive in this cutthroat digital age.
But how do you know where to target your audience? What time is best to connect with them? And which platforms should you focus on the most? Getting your socially-driven affairs in order can seem like an impossible feat, but with social media reporting, you will be able to gain the insights you need to attain the results you deserve. When you add up modern technology and a professional report tool, your reporting processes in the social realm will reap many rewards.
Download our bite-sized guide and start with social reporting today!
Here, we explore the meaning and value of social reporting plus the value of a social media marketing report, as well as the tools you need to get the job done properly – starting by considering what these reports are and their role in today’s hyper-connected business world. After that, we will present benefits that these reports have on offer and finish with examples and templates from real business scenarios. Without further ado, let’s get started.
What Is A Social Media Report?
A social media report offers a means of extracting value from data based on various social networks (Facebook, Twitter, LinkedIn, YouTube, etc.) and metrics (follows, likes, reach, growth, awareness, post performance, engagements, etc.) over various time frames.
Social media marketing reporting is based on a curated collection of data and statistics that are customized based on your business’s social marketing activities and goals.
By using social media management reporting software to track, measure, and refine your socially-driven efforts, you will make better, swifter, and more informed decisions while maximizing your ROI with every initiative or interaction you make.
Why Should I Use Social Media Reports?
Social platform marketing covers a wide range of platforms, plans, campaigns, content, and strategic initiatives. Being able to make intelligent decisions that will streamline your efforts will pay dividends.
That said, a social media performance report will open your eyes to a wealth of information that will help you generate leads, cultivate long-lasting customer relationships, and create content that is shareworthy and will boost your levels of brand awareness.
In the digital age, shooting in the dark and hoping for the best just won’t do. You have to use data to your advantage, and use it well by choosing the right digital marketing KPIs that will help in your overall social strategy. Whether a social media report for Facebook or a social media analysis report for any other platform, here are the primary reasons you should use digital dashboards to your advantage:
- Smarter content creation: Data based on factors including the ideal post length and most engaging themes for your business’s audience will help you create and promote more valuable, engaging content for your audience on each social platform.
- Results-driven scheduling: A monthly social media report can offer invaluable insights into the best times of the day, week, or month to interact or share content with your audience, as well as which topics are likely to resonate with prospects. By understanding this information, you’ll be able to schedule posts and deliver campaigns strategically, and in turn, enjoy maximum results from all of your social marketing efforts. This should be done by selecting accurate social media KPIs which we will explain later in more detail.
- Tailored targeting: Social media analytics reports offer a level of insight that allows you to drill down deep into platform-specific data and ultimately plan strategic efforts and activities tailored to each platform rather than adopting a one-size-fits-all approach to your promotional efforts. With the help of an online data analysis tool, this targeting can be built up significantly.
- Customized tracking and performance measurement: Tracking your efforts and target-setting is the key to ongoing growth and success, and these kinds of reports provide a host of insights that will help you tackle specific roadblocks, overcome challenges, and discover fresh information that will help you drive the business forward.
- Identifying trends and new opportunities: The possibility to conduct research and connect with other, international markets while keeping expenditures on a minimum level, provides a benefit that other channels may not have. Discovering new consumer behavior and detecting new areas of potential selling points, can, and will, increase the reach of a brand.
- Delivering added value to audiences: Another undeniable benefit of tracking your social platforms’ activities is the fact that you will stand a greater chance of leveraging trending hashtags, viral movements, and trends, finding unique ways to inspire, entertain and deliver value to your audience.
“You can never go wrong by investing in communities and the human beings within them.” – Pam Moore
As we just established, tracking and measuring your activity is pivotal to success, and reports are a great tool. If you track your social activity on a consistent basis, you will not only grow your audience but also foster customer loyalty, turning one-time buyers into long-term brand advocates.
Moreover, these kinds of reports, when customized to your specific needs and goals, will help you become more approachable to potential customers as it will allow you to establish the perfect brand voice for each platform while helping you to improve your response rates and levels of social-based customer service.
Seventy-one percent of consumers who have reported a positive social experience with a brand are likely to recommend it to others. Track and measure your efforts, and you will satisfy your customers, reaping the rewards of growth, loyalty, and prosperity in the process. Need we say more?
Download our bite-sized guide and start with social reporting today!
How Do I Create A Social Media Report?
There is no one, single, black and white way to create a report. Depending on the specific use-case and what kind of metrics you want to track, the reporting process for various social channels will be different. There are some core questions you need to answer before creating a report, and there are some best practices to follow in order to create the best possible report for your social efforts. Here we will name a standard process that should make your practice easier:

1. Define your stakeholders
To put your data into perspective for each stakeholder involved, no matter if it’s from sales, marketing or external client, you need to know who you are addressing the report to. To know what data goes into a social media report, you need to answer a simple question: who am I addressing my report to?
2. Choose the right metrics
The metrics you choose should be adjusted depending on the social platform. Although they’re all social, each network has its own set of rules and best practices. It should be wisely considered what kind of operational metrics you want to track, whether you need to focus on strategic and high-level KPIs or you need a combination of both?
3. Identify your reporting schedule
While social posts can go viral in no-time, it is also important to keep an overview of the big picture. It’s advisable to schedule regular reports while connecting to your social accounts on a daily basis (don’t forget about community management, although this can be a subject on its own). Reports can be sent on a weekly, monthly or quarterly basis but you need to decide this based on your social schedule.
4. Pick the right presentation tool
There are numerous data reporting tools on the market that can help you in presenting your information, but just a few provide features that will make your work extremely simple and straightforward. Especially if you need to combine numerous social networks, you need to be careful in choosing the right software. A tool that will enable you to access real-time data, automate your reports and simplify your sharing processes might be a better solution than a traditional spreadsheet.
To see the importance of social networks and reports in practice, we have selected 8 examples that will show you not just what goes into a monthly social media report, but also particularities of each. You will be equipped with enough insights to start creating your own reports and use these templates to your advantage.
Discover Our Top 8 Social Media Report Examples
By now, it’s clear just how valuable social reports are for modern businesses looking to make a real impact with their marketing efforts. To help put this into perspective, here is a selection of real-life social media report examples for your viewing pleasure. With these user-friendly online dashboards, you will see how each interface is intuitive, navigable, and simple to customize.
Without further ado, let’s look at our first social media reporting template, focused on Facebook.
1. Social Media Reports For Facebook
Facebook is the most wide-spread social channel in the world. With billions of users across the world, tracking and analyzing social activities on this platform is essential. Here we deliver a sample social media report for your Facebook page and another one for Facebook post management.
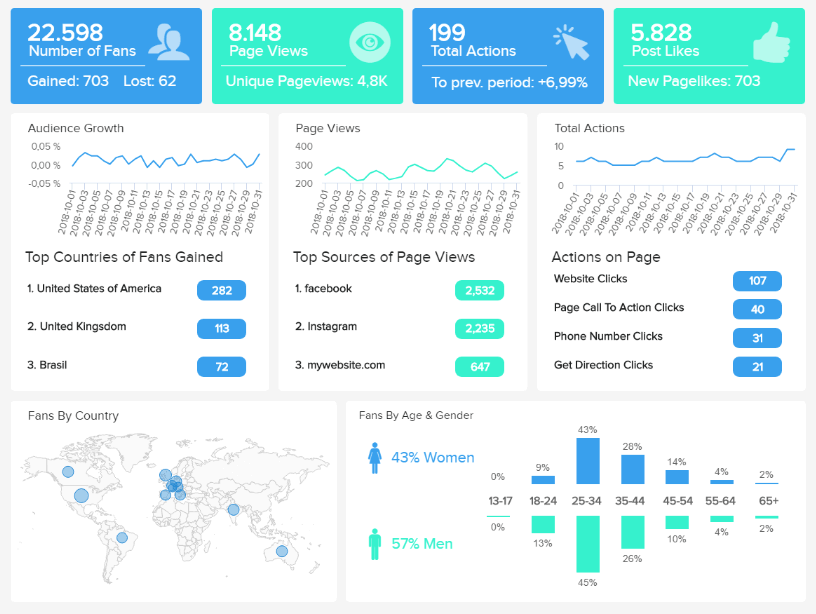
a) Facebook Page Dashboard
**click to enlarge**
The first of our report templates is dedicated to the world’s largest social network – Facebook. With 1.47 billion people that login daily, this network is still on top of search engines with 78% of American consumers that have discovered retail products to buy just on this network. This is an astonishing potential that, if used wisely, can ensure sustainable business development. For this reason, the reporting practice becomes even more important since it can provide the exact numbers on how your company is developing on this social network.
As Facebook has its own set of rules, practices, and metrics, this invaluable report template offers a real insight into page views, behaviors, interactions, priceless follow demographics, likes, engagements, and a host of other essential information that will help you refine your Facebook marketing strategy.
Primary KPIs:
- Number of Fans
- Follower Demographics
- Page Views by Sources
- Actions on Page
To find out more about this social media report template, explore our Facebook dashboards in greater detail.
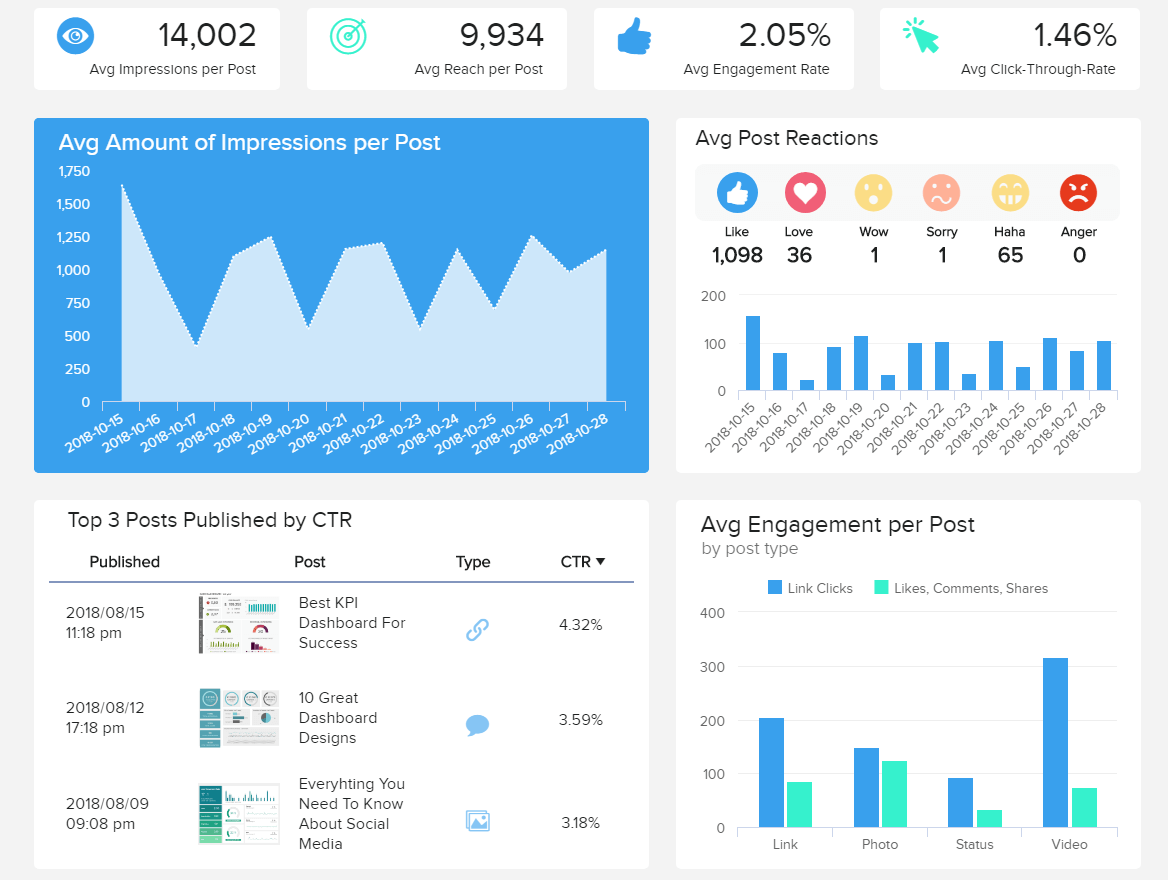
b) Facebook Post Dashboard
**click to enlarge**
Our rundown of social media reporting dashboards wouldn’t be complete without taking a closer look at the post level of this social network. While monitoring the big picture of the overall Facebook page is essential, analyzing posts will deliver even more value to your social strategies.
Our dashboard begins with a simple overview of the number of impressions, and the average values of metrics such as reach per post, engagement rate, and CTR. That way you can get an overview of how your posts are performing but you might want to follow-up with more details. That’s why, in this dashboard, you can see additional Facebook KPIs visualized in a clean and straightforward way: the average amount of impressions per post, post reactions, top 3 posts by CTR and average engagement per post. These metrics can tell you a number of things: what type of posts work best, what kind of reactions do you generate from your audience and how many people see your posts, among other important elements to create a comprehensive social data-story.
Primary KPIs:
- Reach by Post Type
- Post Engagement Rate
- Click-through-rate (CTR)
2. LinkedIn Social Media Report Samples
If you want your business to thrive in online social settings, you need to develop and manage a LinkedIn account. LinkedIn has numerous benefits and it’s considered as the number one platform for business-related social communication. To steer your success on this invaluable network, we have prepared 2 social media reporting templates that you can use for your potential online business influence.
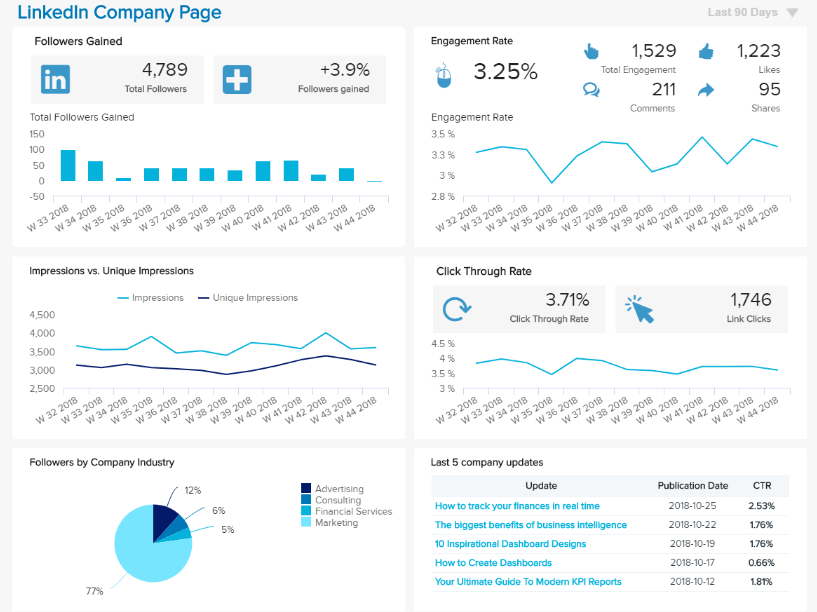
a) LinkedIn Company Page Dashboard
**click to enlarge**
LinkedIn is undoubtedly the planet’s premier professional network, and the second of our social media report templates focuses solely on this ever-expanding platform. With more than 500 million members, of about 61 million users are senior-level influencers, the potential in the B2B environment increases each year. That’s just the tip of the iceberg on why tracking this social platform is of utmost importance. Let’s see how this can be done in our example.
A prime monthly social media report example (although it’s entirely possible to track metrics and interactions on a daily or weekly basis), our LinkedIn reporting dashboard offers comprehensive information on company update frequency. Follower demographics, engagement rates, and more – all geared towards remaining relevant, present, and growing those all-important professional relationships on a consistent basis.
Primary KPIs:
- Followers’ Demographics
- Number of Followers
- Impressions & Reach
- Engagement Rate
- Company Update Stats
To discover more about this particular report example, explore our LinkedIn dashboards & templates in more depth.
b) LinkedIn Individual Profile Dashboard
**click to enlarge**
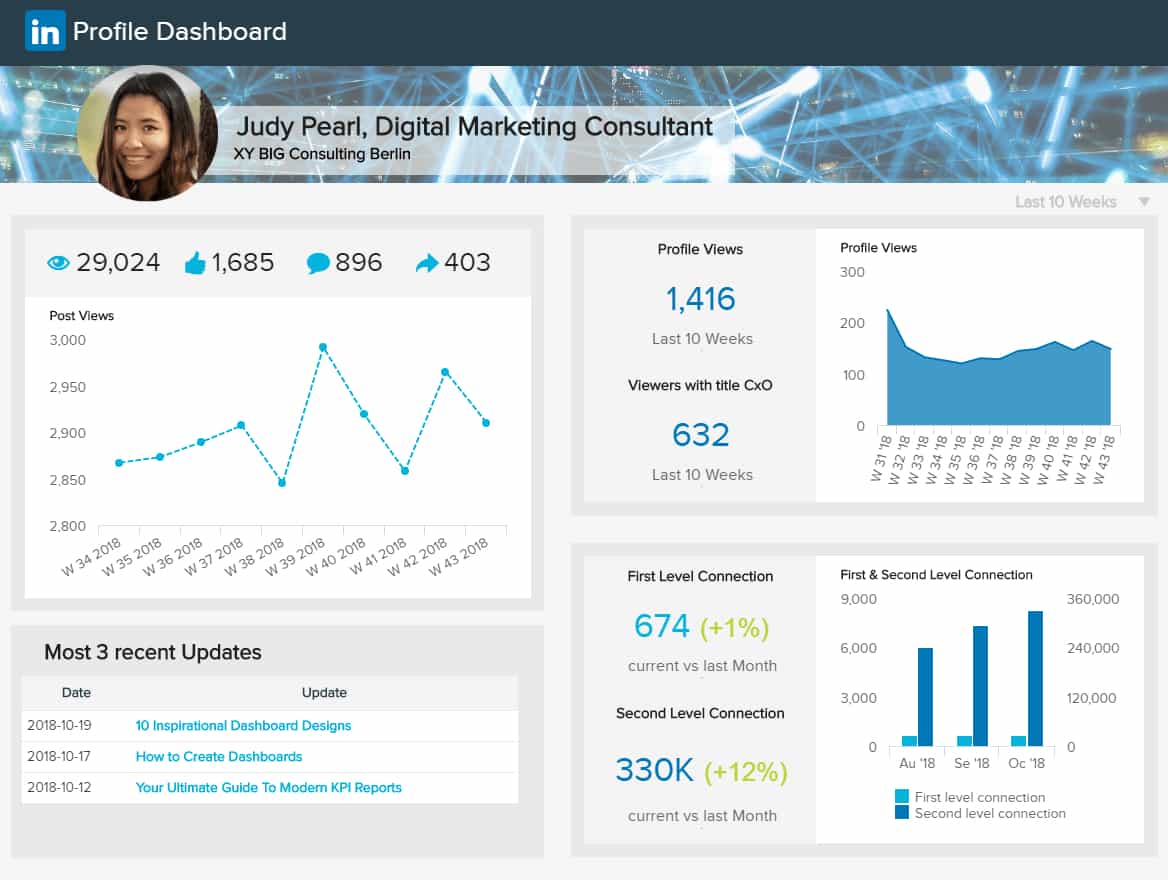
Not just important for your company’s profile, but the individual as well, LinkedIn is one of the networks where you can easily find business influencers and connect with numerous peers across the globe. Individual profile users can benefit from such a dashboard since your business profile on LinkedIn can generate valuable results not just for your company, but your individual efforts as well.
This social media metrics report template is created with the help of a dashboard generator, where you can also find numerous other templates and easily start building your own dashboard or report. Metrics based on post and profile views, monitored across specified weeks, will immediately let you know how your published content performed over a course of time, how well is received and do you need to adjust your strategies. This is not only crucial for companies but if you’re striving to brand your name and develop your personal presence, you need this dashboard in your life.
Another LinkedIn KPI, the 3 most recent updates will remind you what did you recently publish and if you see a spike, you might want to consider taking a closer look at those posts.
Primary KPIs:
- Viewer Information
- Contact & Network Growth
- Profile Views by Job Title
- Post Views & Engagements
3. Twitter Social Media Monthly Report Templates
Twitter is another social platform that companies and individuals can use to their advantage, depending on the type of brand they want to build. The content aspect that Twitter established forced brands across the world to keep their message short and clear. This type of content revolutionized online communication and is still popular today. Twitter is a platform that, if used correctly, can benefit the business in no-time.
Let’s start by explaining in more detail a social media metrics report template focused on Twitter performance.
a) Tweet Performance Dashboard
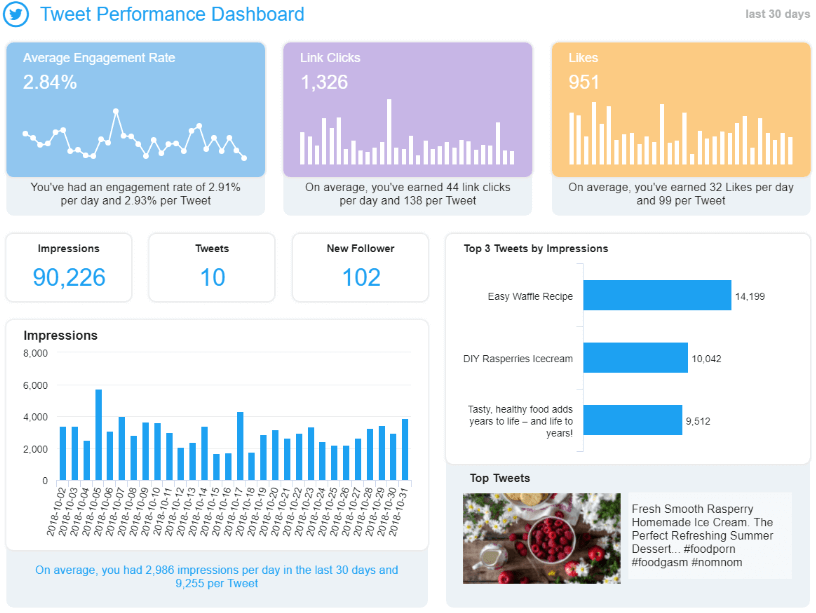
![Tweet performance dashboard expounds on important metrics like the average engagement rate, number of link clicks, likes, impressions, etc.]()
**click to enlarge**
Twitter remains one of the most popular and relevant social networking platforms on the planet, and the third of our reporting examples drills down into what makes the platform tick – the tweets. With more than 500 million tweets sent each day, and 24% of total users being urban, educated, higher-income adults, Twitter holds the possibility to interact with the right demographics, at the right moment. Let’s take a look at our template to see what kind of reports we can extract.
This is a social media performance report template that is certain to enhance your Twitter marketing strategy. The Tweet performance dashboard tracks key activities over a 30-day period while offering a balanced mix of KPIs that will help you boost engagement and streamline your promotional strategy on a continual basis. This is a KPI report example that you should take note of, particularly if you’re looking to achieve total Twitter domination in your niche.
Primary KPIs:
- Average Number of Link Clicks
- Average Engagement Rate
- Average Number of Impressions
- Top 5 Tweets by Engagement
To discover more about this template and others like it, browse our Twitter dashboards & templates.
b) Twitter Ads Dashboard
**click to enlarge**
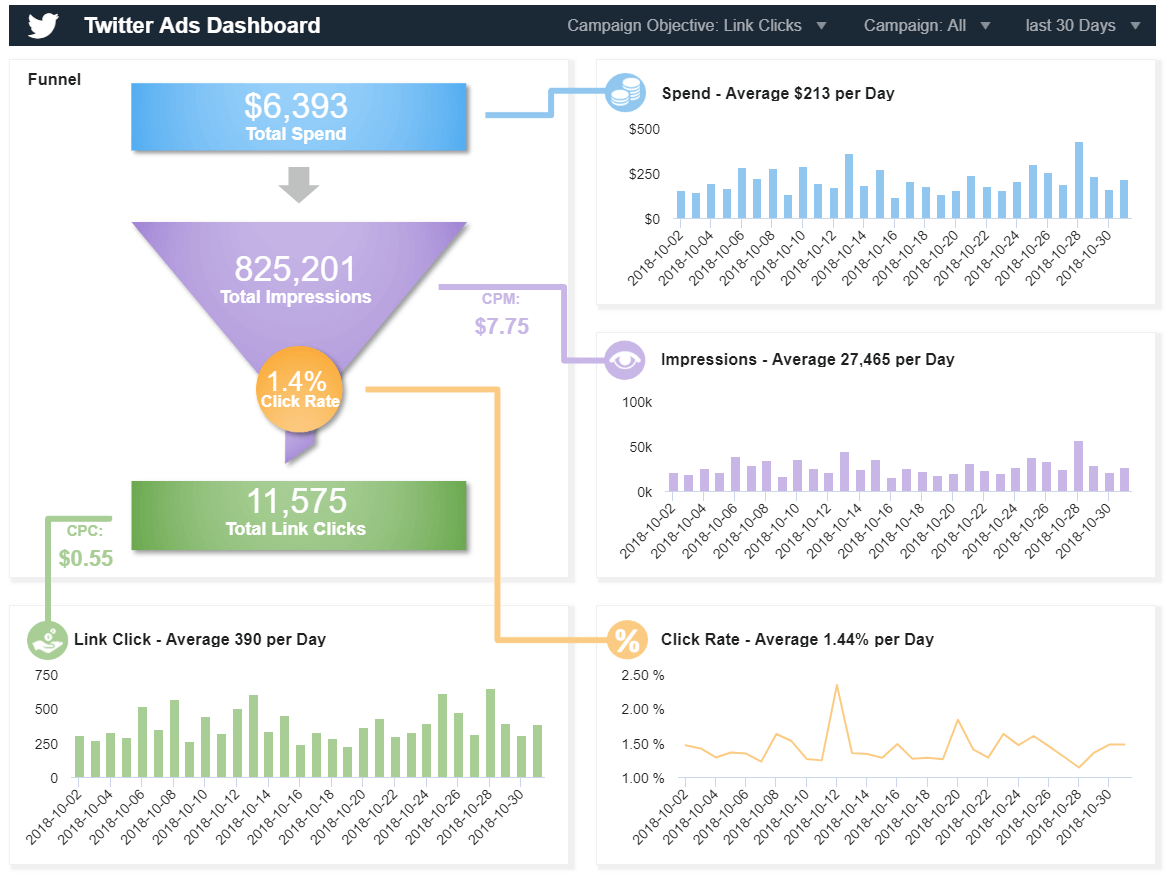
If you want to succeed in your marketing efforts, performing paid advertisements on Twitter is one of our suggestions you might want to look into. The potential of this network is undeniable, and by boosting your online social efforts, you can improve your company’s bottom line exponentially. Our Twitter Ads dashboard will show you how.
This dashboard, created with a social media reporting software, focuses on the most important metrics for managing successful advertising efforts: the total budget spent, the number of impressions, link clicks and the average values per day for the past month. Looking at a monthly level, you can gain a better understanding of your overall performance but don’t forget to generate the daily view of the funnel, just like on our dashboard. That way, you will have a more detailed overview of which days were more successful so you can adjust your strategies accordingly.
Primary KPIs:
- CPM of Twitter Ads
- Result Rate of Twitter Ads
- Cost per Result
4. Social Media Report Templates For YouTube
YouTube is a social network focused on videos. We have seen numerous cases where videos go viral, hence, this network shouldn’t be disregarded that easily. In fact, YouTube leads the way in regards to video platforms in the world, but also as the second largest search engine right after Google. The potential is indisputable. We will start with an example of a monthly social media report for video performance.
a) YouTube Video Performance Dashboard
**click to enlarge**
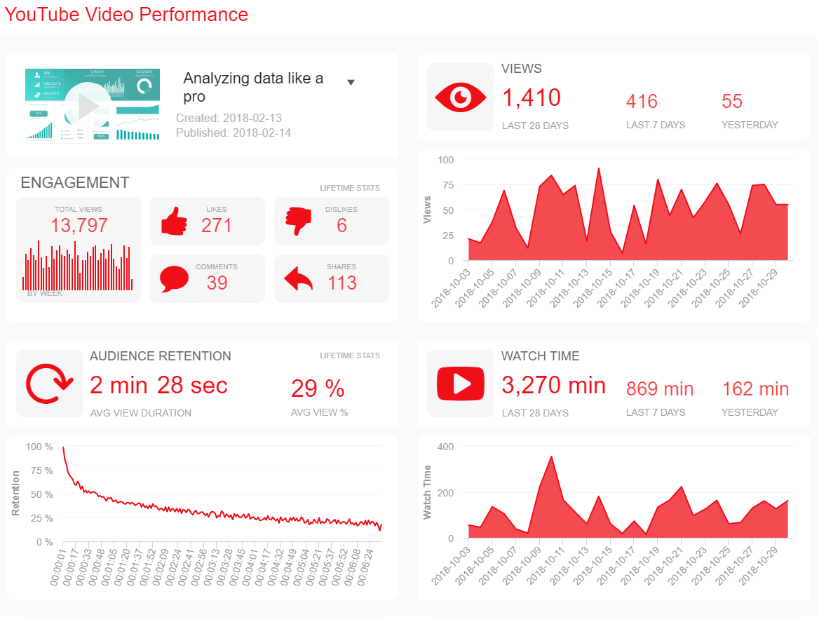
YouTube is the top video platform in the world, and that’s a fact. With more than 1.9 billion logged in monthly users, you can navigate the platform in a total of 80 different languages, over 91 countries, and reach more 18-49 year-olds than on any broadcast or Cable TV network. These astonishing facts put YouTube also as the second largest search engine and the third most visited site after Google and Facebook. That being said, the monitoring and reporting of this network are invaluable for any video marketing strategy.
One of our social media report templates of the video variety, the YouTube video performance dashboard will help you improve your video-based marketing efforts.
Offering key metrics on viewer engagement as well as retention, this social media analytics report template will allow you to improve the visual content you produce as well as tailor it to the needs, preferences, and interests of your target audience.
Plus, KPIs like total watch time and video views will help you understand what is and isn’t working, allowing you to make essential tweaks to your YouTube strategy over time. A report example that every business should explore, regardless of industry or sector.
Primary KPIs:
- Total Watch Time
- Total Number of Video Views
- Viewer Retention
- Video Engagement
To find out more about this reporting template and others like it, explore our mix of YouTube dashboard examples & templates.
b) YouTube Channel Performance Dashboard
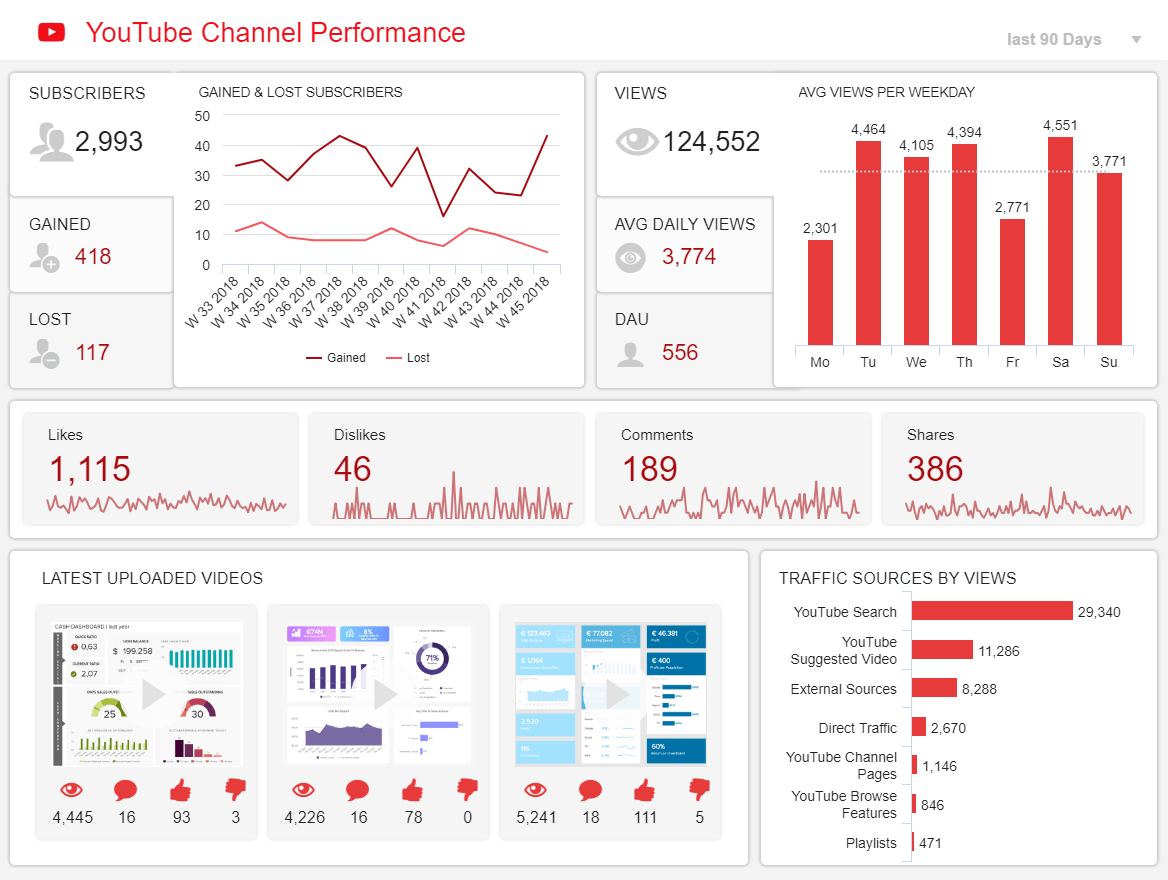
**click to enlarge**
While monitoring your video performance is essential, your channel performance is another important element in your social strategy and we will now explain why, and how you can use these notions to your own advantage.
This social media marketing report template focuses on the analytics part of your channel production. You need to deliver results in order to be successful on YouTube and producing videos only will not suffice. The data behind the channel will tell you if your audience resonates with your message or you need further adjustments. An operational dashboard focused on your channel performance will answer all questions related to your subscribers and traffic.
Download our bite-sized guide and start with social reporting today!
While it may be a competitive landscape, social platforms are potentially prosperous, profitable playing fields for brands that know how to use them to their advantage. It’s no secret that the huge potential of utilizing these networks, with both organic and paid opportunities, should be one of the top priorities for companies that know how to target their audiences and create performance-based analytical reports. For that reason, a neat reporting practice is an invaluable resource to fully obtain the benefits of your social networking strategy. Embrace the power of social reporting today, and you’ll reap endless rewards tomorrow – and long into the future.
For more insights into the virtues of data analytics, you can explore 250 KPI examples we have carefully prepared.
And if you want to tackle even deeper into social networks and reporting, you can try our software for a 14-day trial completely free!
The post Take Advantage Of Professional Social Media Reports – Examples & Templates appeared first on BI Blog | Data Visualization & Analytics Blog | datapine.